# v0.34.x
# 200 Node Testnet
# Finding the Saturation Point
The first goal when examining the results of the tests is identifying the saturation point. The saturation point is a setup with a transaction load big enough to prevent the testnet from being stable: the load runner tries to produce slightly more transactions than can be processed by the testnet.
The following table summarizes the results for v0.34.x, for the different experiments
(extracted from file v034_report_tabbed.txt).
The X axis of this table is c, the number of connections created by the load runner process to the target node.
The Y axis of this table is r, the rate or number of transactions issued per second.
| c=1 | c=2 | c=4 | |
|---|---|---|---|
| r=25 | 2225 | 4450 | 8900 |
| r=50 | 4450 | 8900 | 17800 |
| r=100 | 8900 | 17800 | 35600 |
| r=200 | 17800 | 35600 | 38660 |
The table shows the number of 1024-byte-long transactions that were produced by the load runner,
and processed by Tendermint, during the 90 seconds of the experiment's duration.
Each cell in the table refers to an experiment with a particular number of websocket connections (c)
to a chosen validator, and the number of transactions per second that the load runner
tries to produce (r). Note that the overall load that the tool attempts to generate is $c \cdot r$.
We can see that the saturation point is beyond the diagonal that spans cells
r=200,c=2r=100,c=4
given that the total transactions should be close to the product of the rate, the number of connections, and the experiment time (89 seconds, since the last batch never gets sent).
All experiments below the saturation diagonal (r=200,c=4) have in common that the total
number of transactions processed is noticeably less than the product $c \cdot r \cdot 89$,
which is the expected number of transactions when the system is able to deal well with the
load.
With r=200,c=4, we obtained 38660 whereas the theoretical number of transactions should
have been $200 \cdot 4 \cdot 89 = 71200$.
At this point, we chose an experiment at the limit of the saturation diagonal,
in order to further study the performance of this release.
The chosen experiment is r=200,c=2.
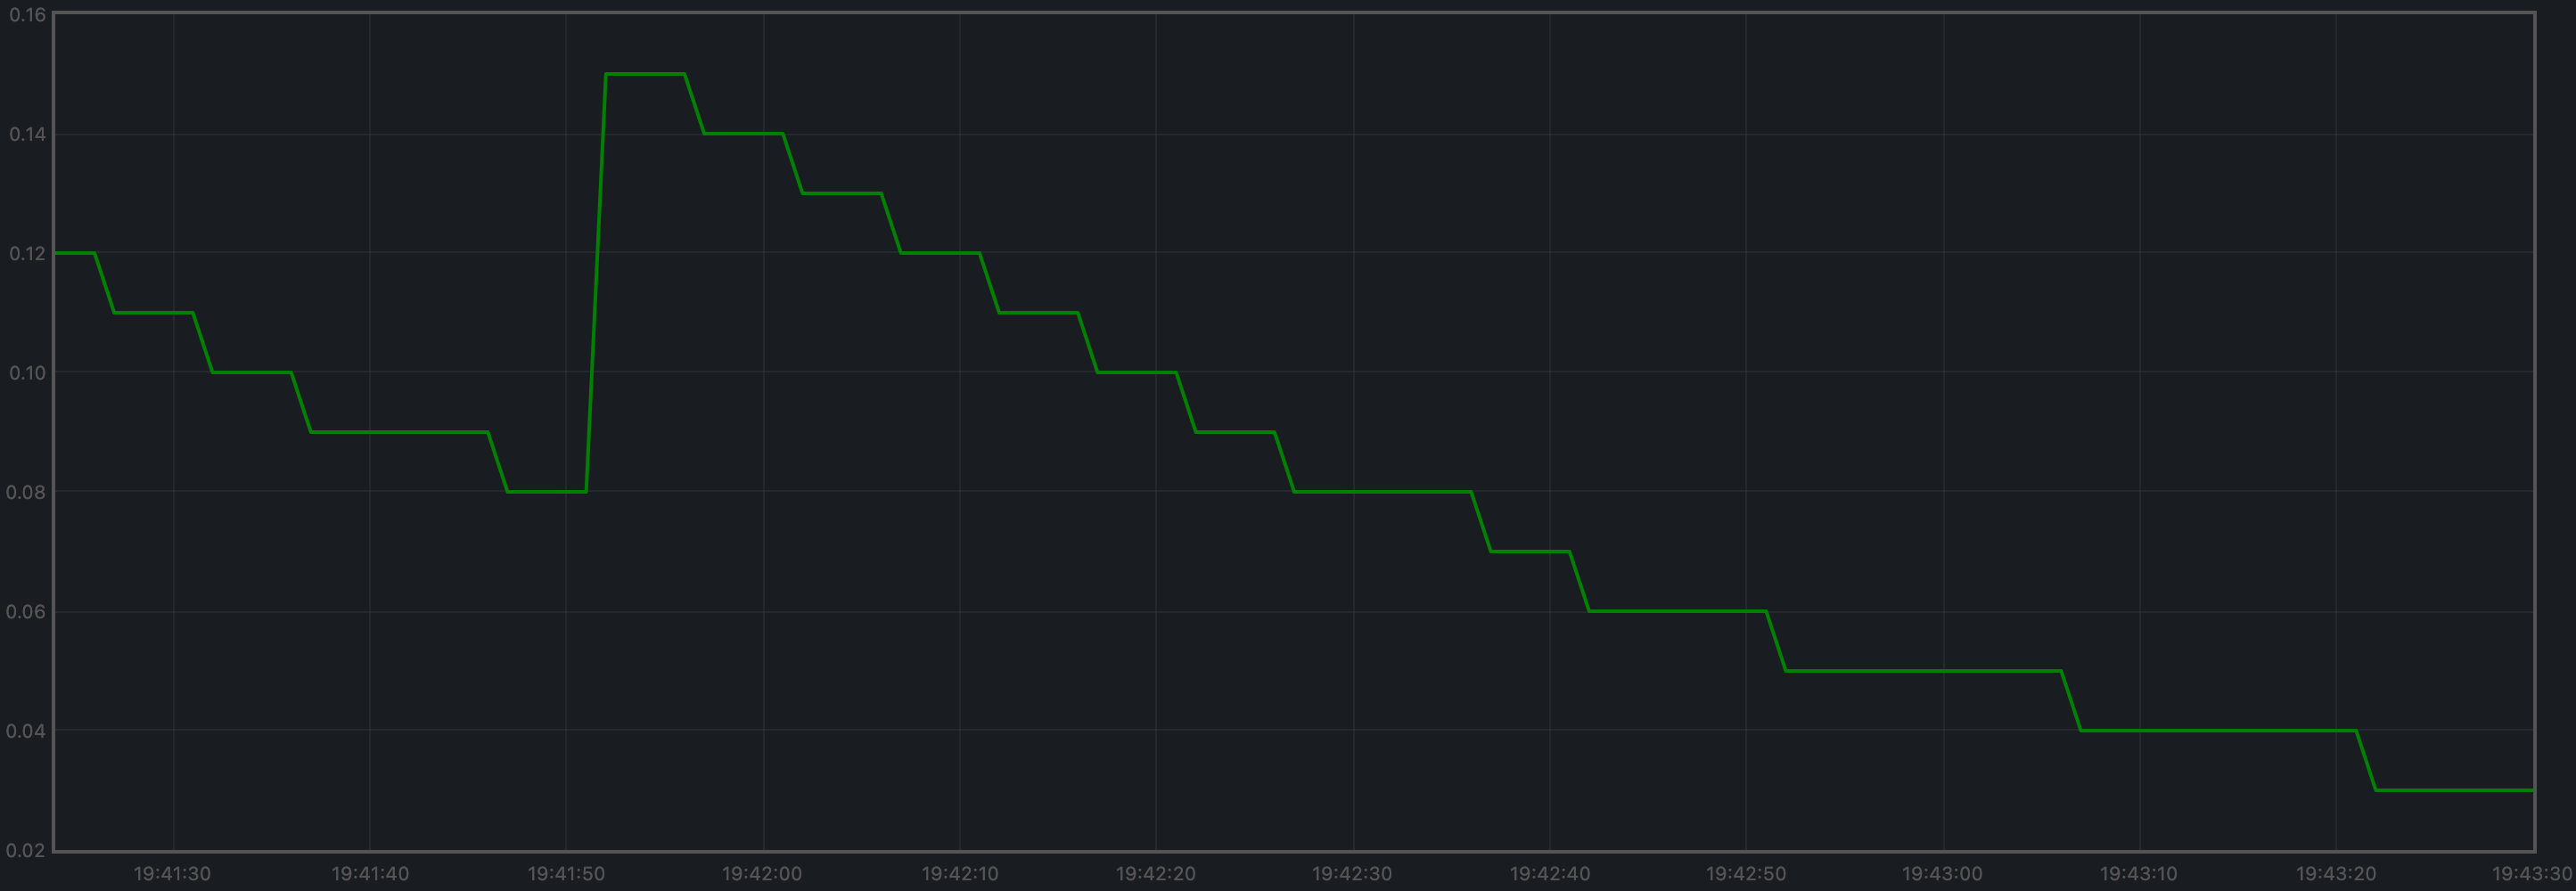
This is a plot of the CPU load (average over 1 minute, as output by top) of the load runner for r=200,c=2,
where we can see that the load stays close to 0 most of the time.
# Examining latencies
The method described here allows us to plot the latencies of transactions for all experiments.
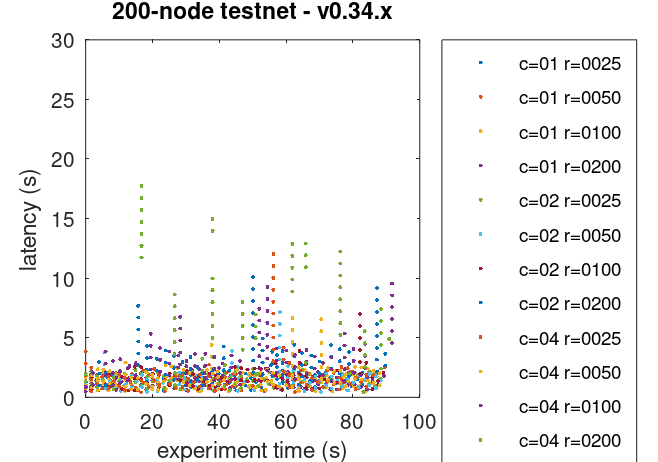
As we can see, even the experiments beyond the saturation diagonal managed to keep transaction latency stable (i.e. not constantly increasing). Our interpretation for this is that contention within Tendermint was propagated, via the websockets, to the load runner, hence the load runner could not produce the target load, but a fraction of it.
Further examination of the Prometheus data (see below), showed that the mempool contained many transactions at steady state, but did not grow much without quickly returning to this steady state. This demonstrates that the transactions were able to be processed by the Tendermint network at least as quickly as they were submitted to the mempool. Finally, the test script made sure that, at the end of an experiment, the mempool was empty so that all transactions submitted to the chain were processed.
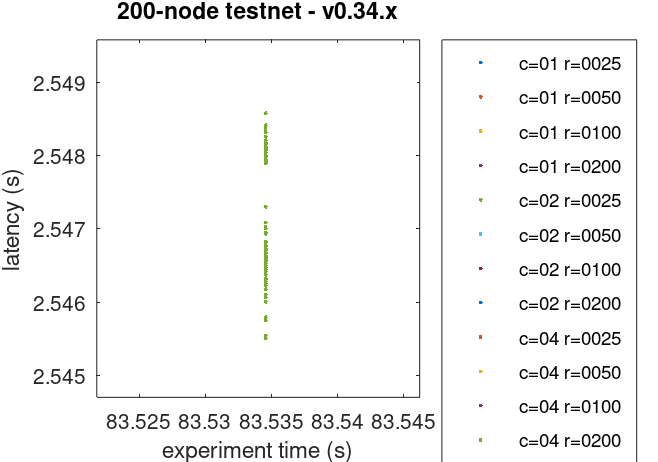
Finally, the number of points present in the plot appears to be much less than expected given the number of transactions in each experiment, particularly close to or above the saturation diagonal. This is a visual effect of the plot; what appear to be points in the plot are actually potentially huge clusters of points. To corroborate this, we have zoomed in the plot above by setting (carefully chosen) tiny axis intervals. The cluster shown below looks like a single point in the plot above.
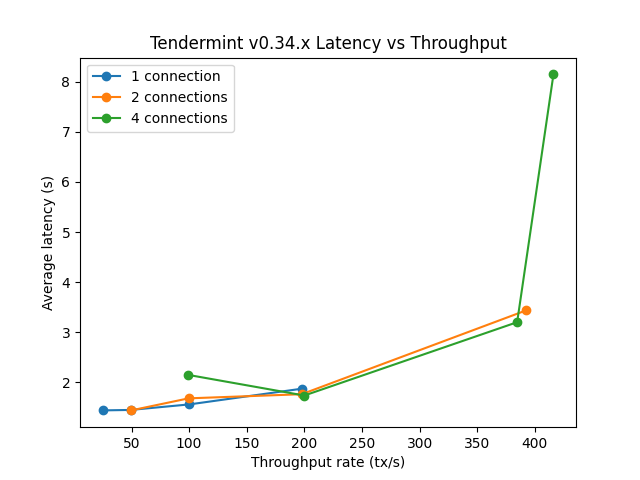
The plot of latencies can we used as a baseline to compare with other releases.
The following plot summarizes average latencies versus overall throughputs across different numbers of WebSocket connections to the node into which transactions are being loaded.
# Prometheus Metrics on the Chosen Experiment
As mentioned above, the chosen experiment is r=200,c=2.
This section further examines key metrics for this experiment extracted from Prometheus data.
# Mempool Size
The mempool size, a count of the number of transactions in the mempool, was shown to be stable and homogeneous at all full nodes. It did not exhibit any unconstrained growth. The plot below shows the evolution over time of the cumulative number of transactions inside all full nodes' mempools at a given time. The two spikes that can be observed correspond to a period where consensus instances proceeded beyond the initial round at some nodes.
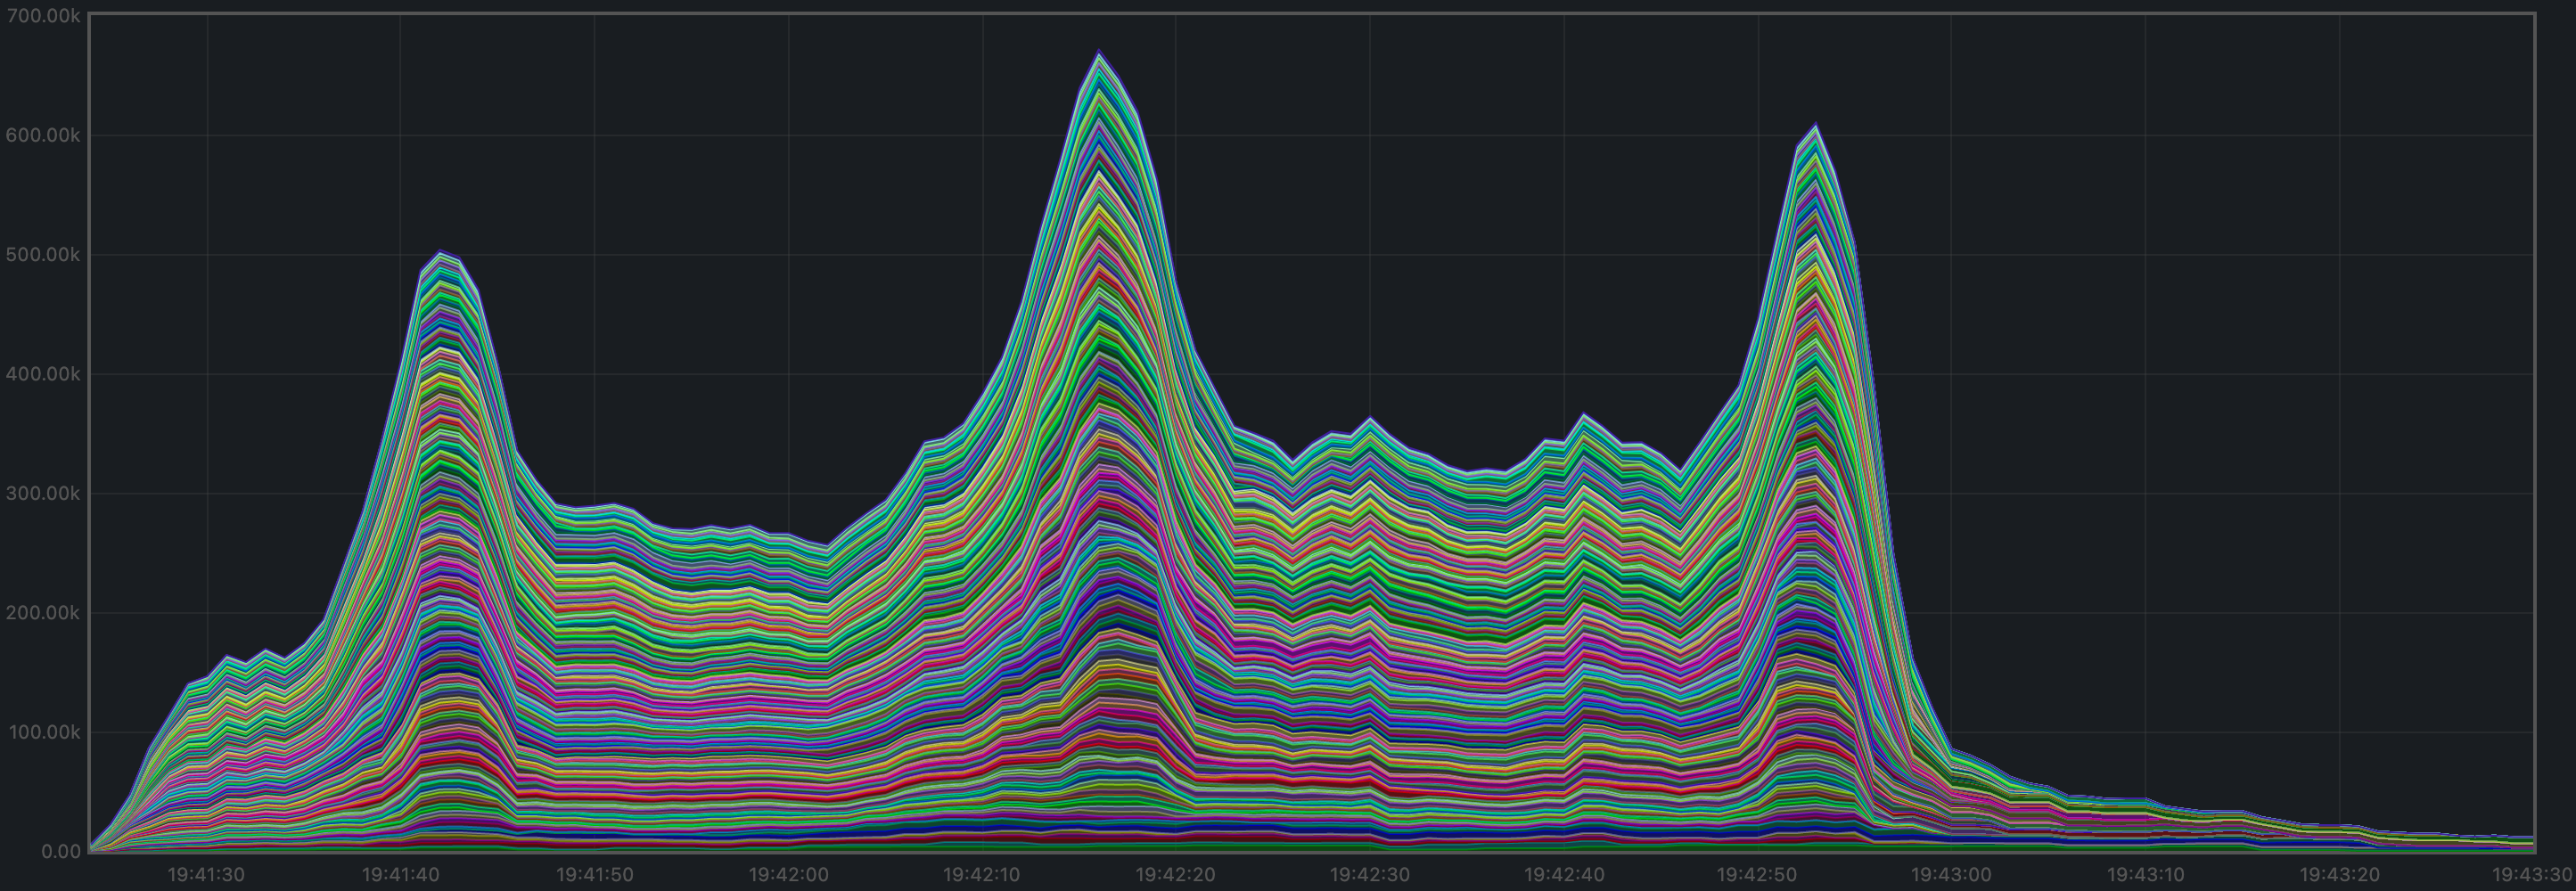
The plot below shows evolution of the average over all full nodes, which oscillates between 1500 and 2000 outstanding transactions.
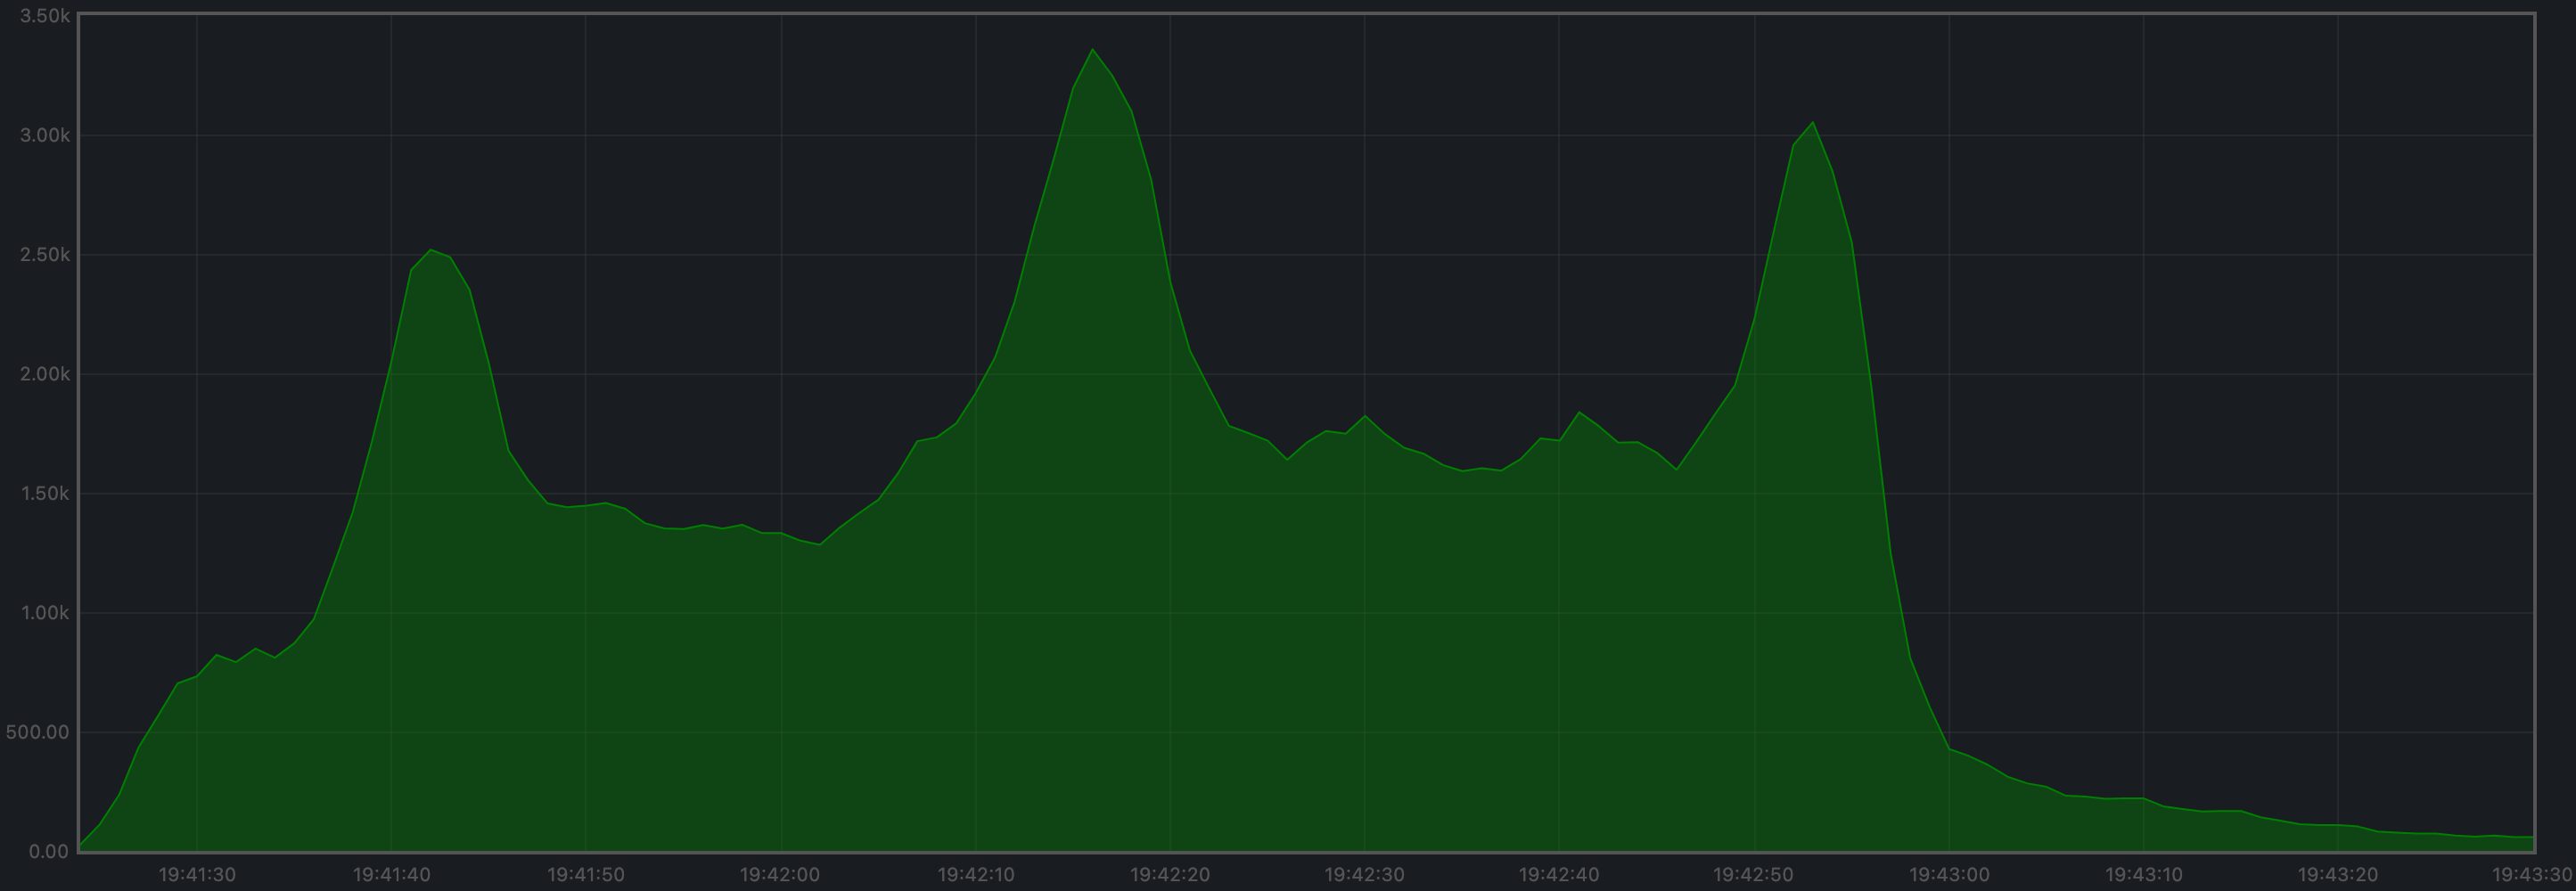
The peaks observed coincide with the moments when some nodes proceeded beyond the initial round of consensus (see below).
# Peers
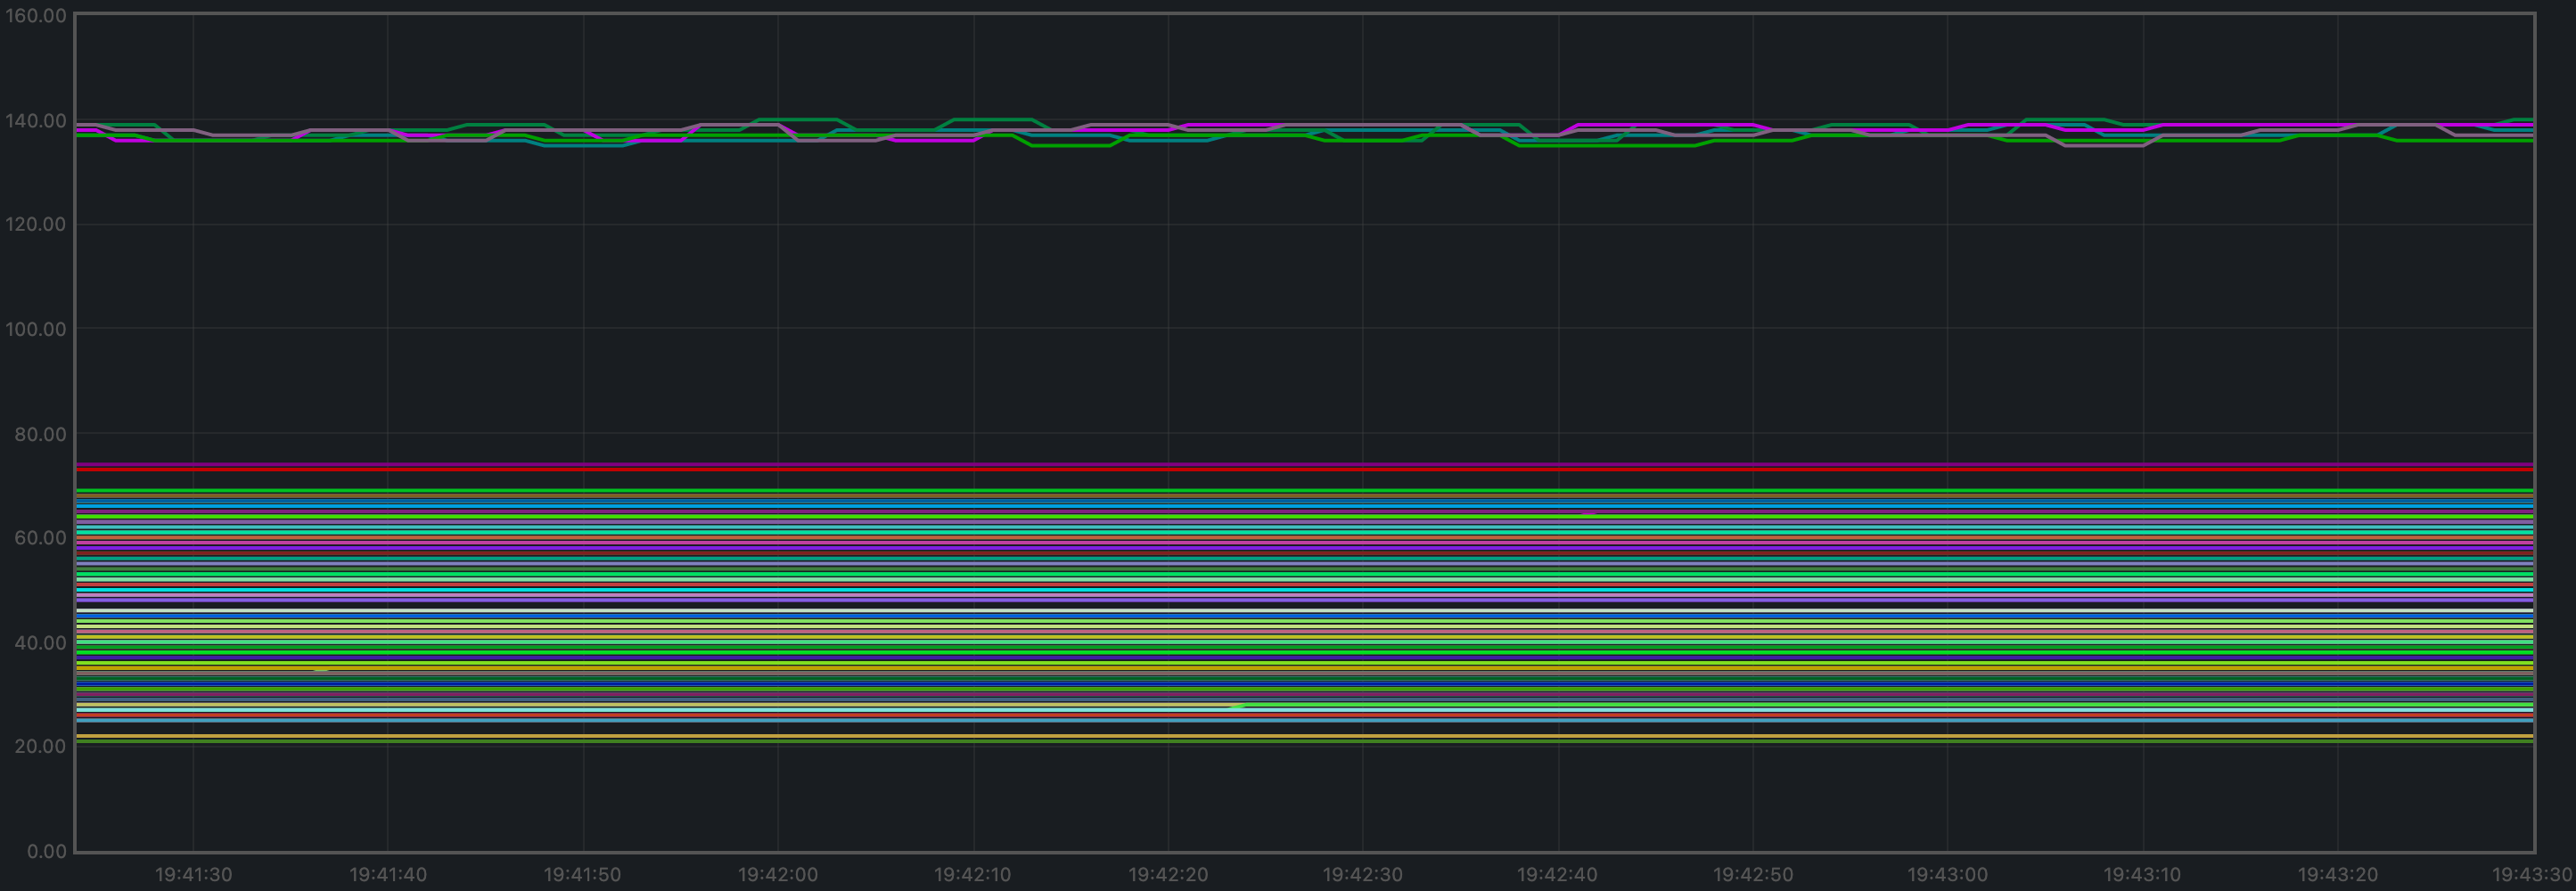
The number of peers was stable at all nodes. It was higher for the seed nodes (around 140) than for the rest (between 21 and 74). The fact that non-seed nodes reach more than 50 peers is due to #9548.
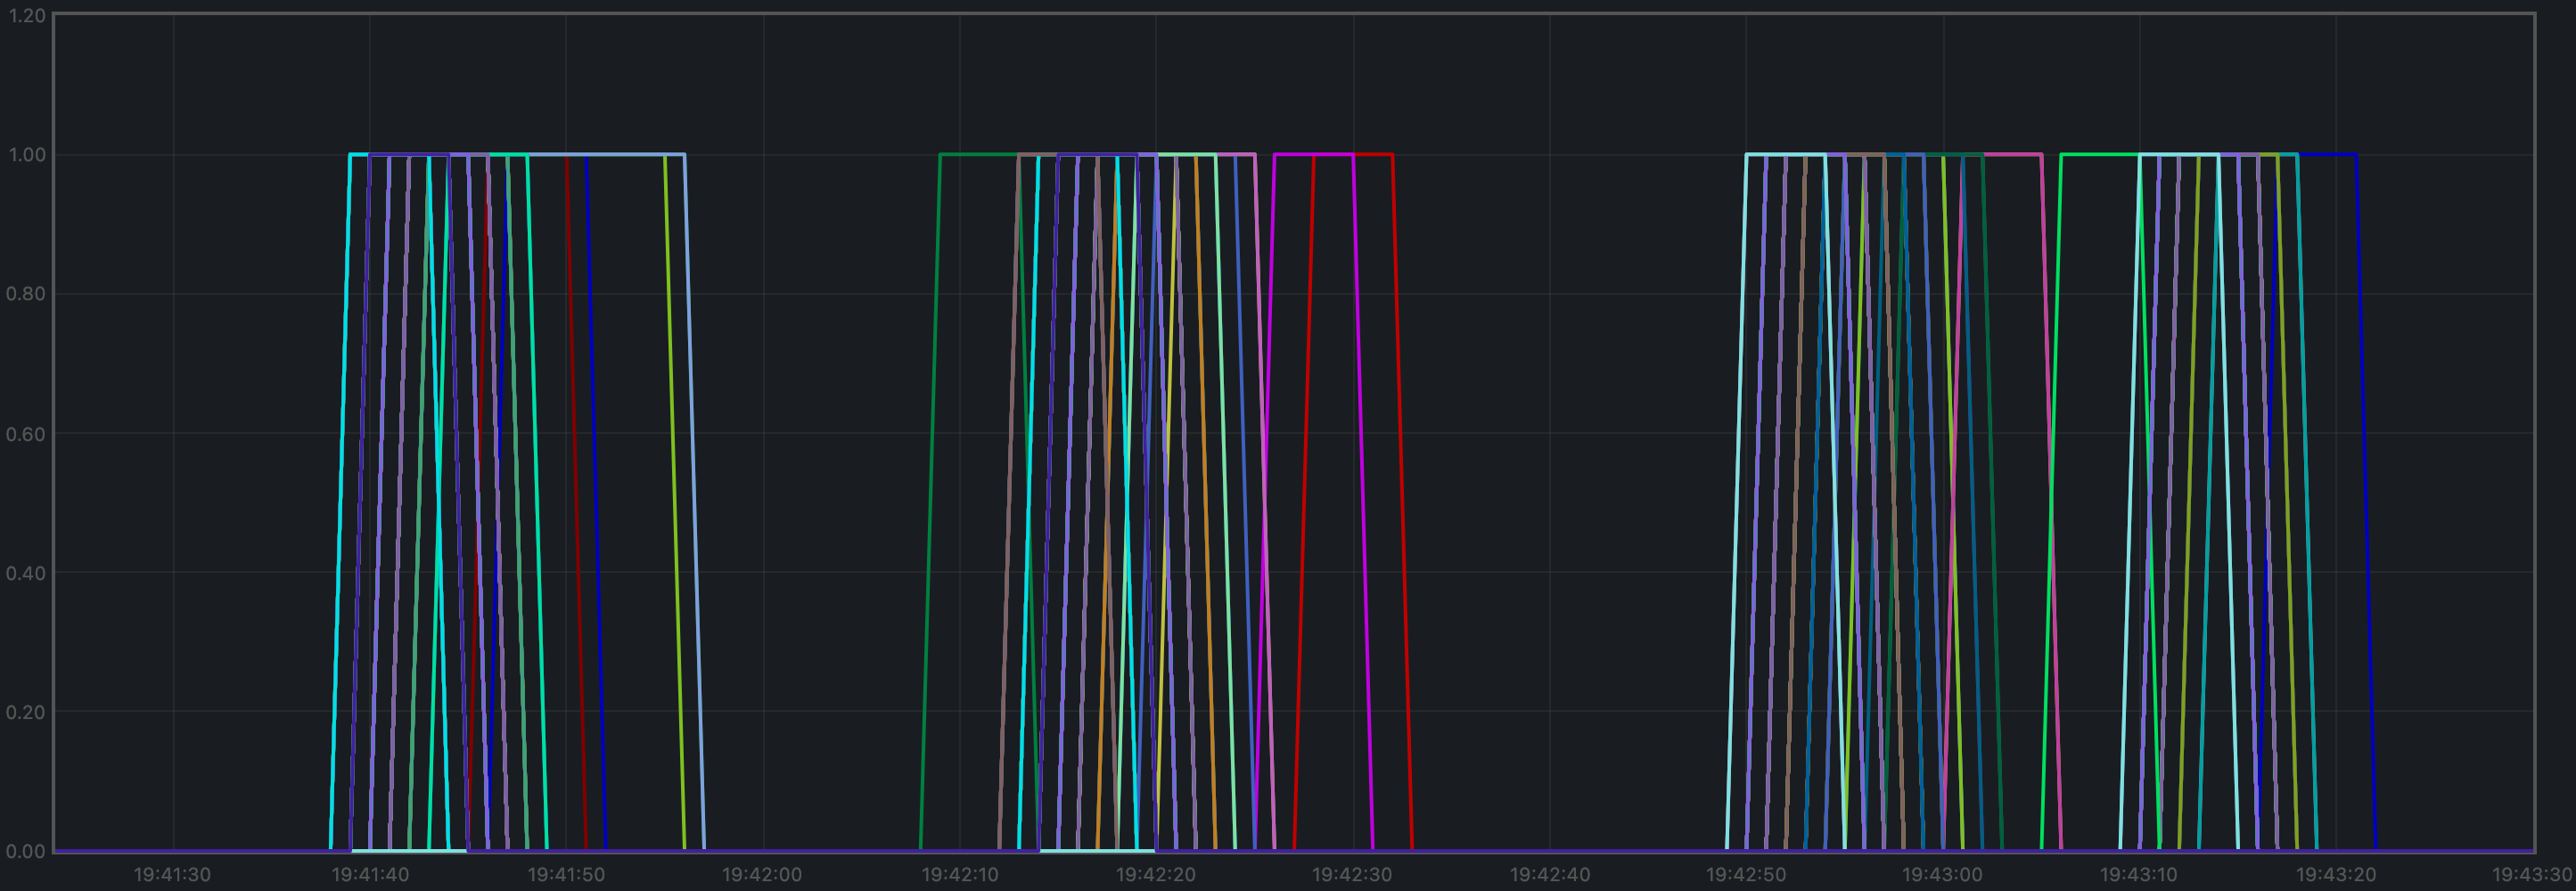
# Consensus Rounds per Height
Most heights took just one round, but some nodes needed to advance to round 1 at some point.
# Blocks Produced per Minute, Transactions Processed per Minute
The blocks produced per minute are the slope of this plot.
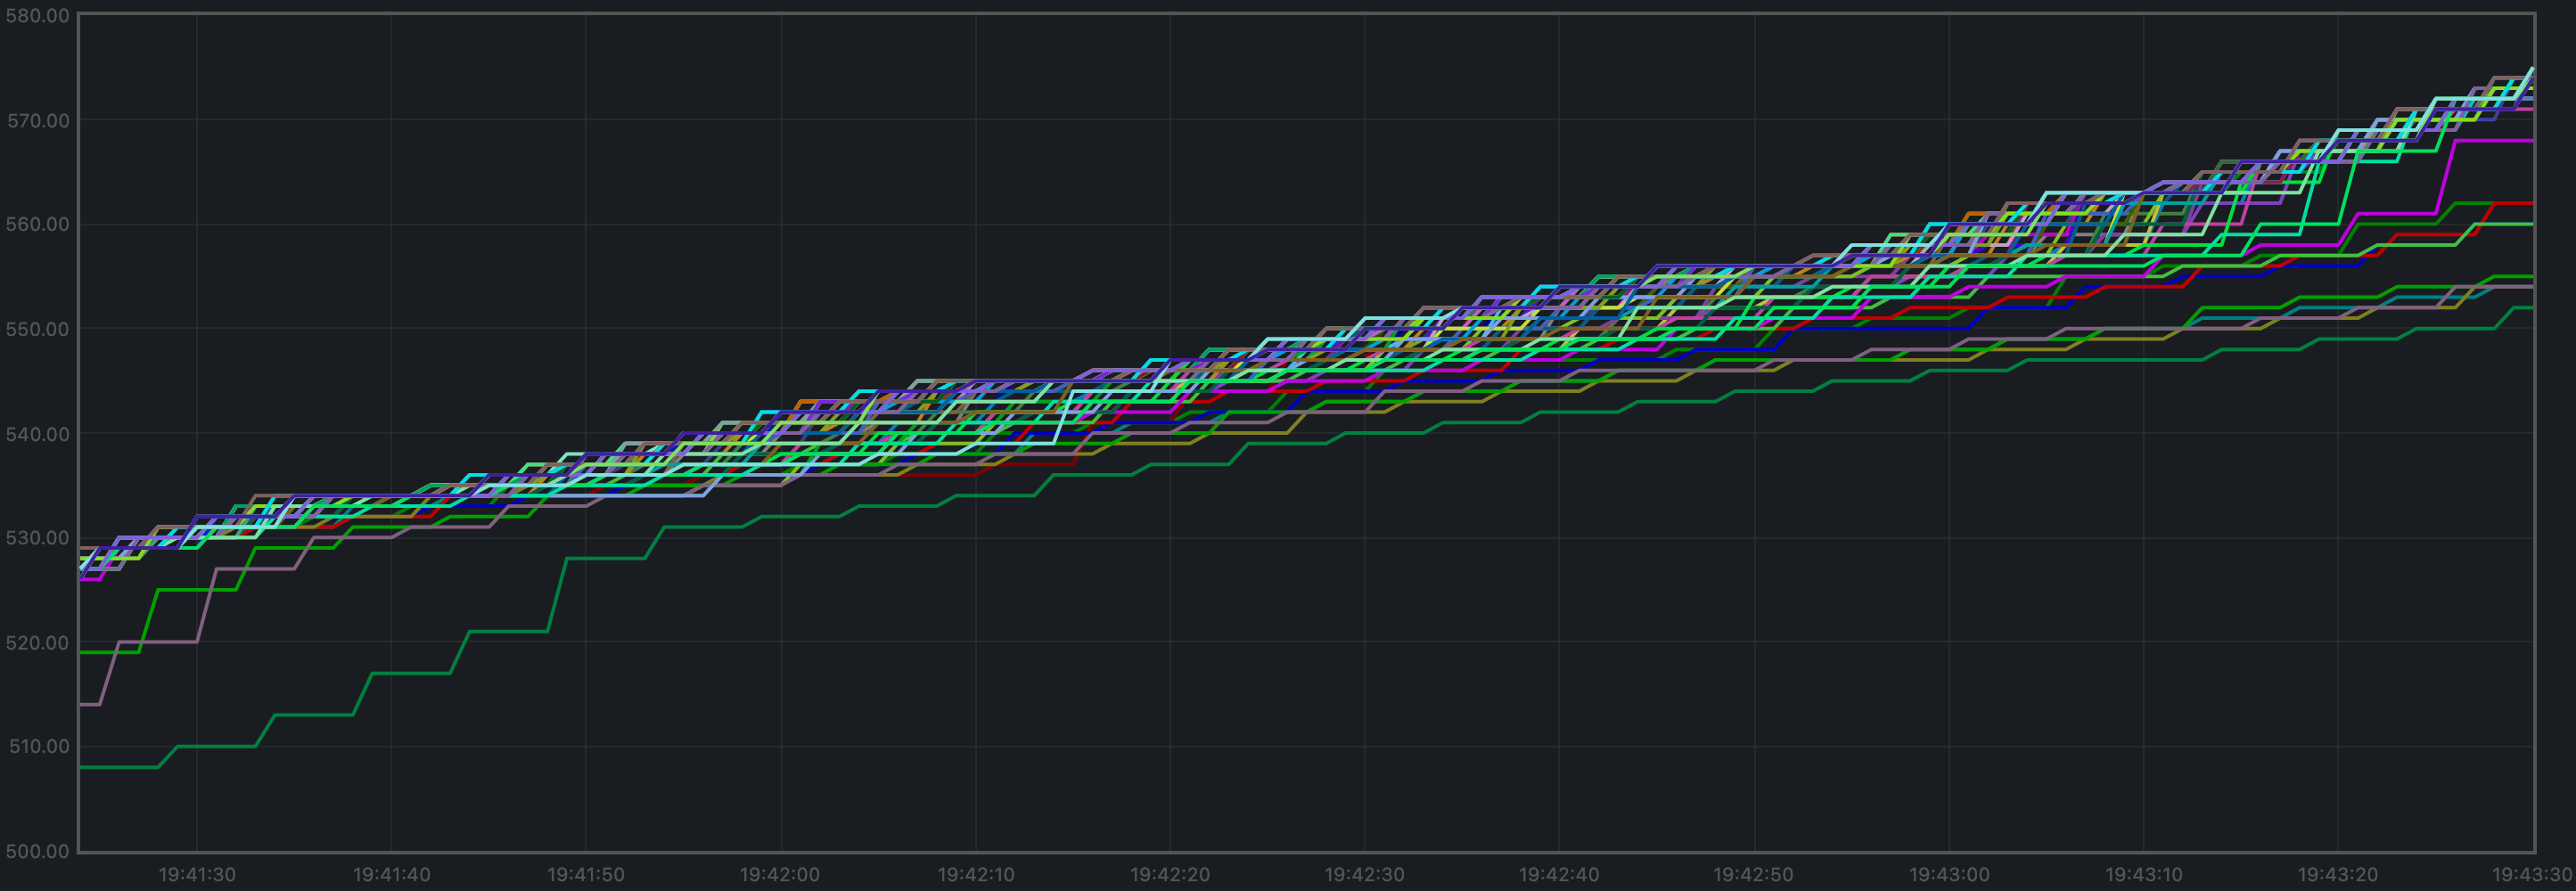
Over a period of 2 minutes, the height goes from 530 to 569. This results in an average of 19.5 blocks produced per minute.
The transactions processed per minute are the slope of this plot.
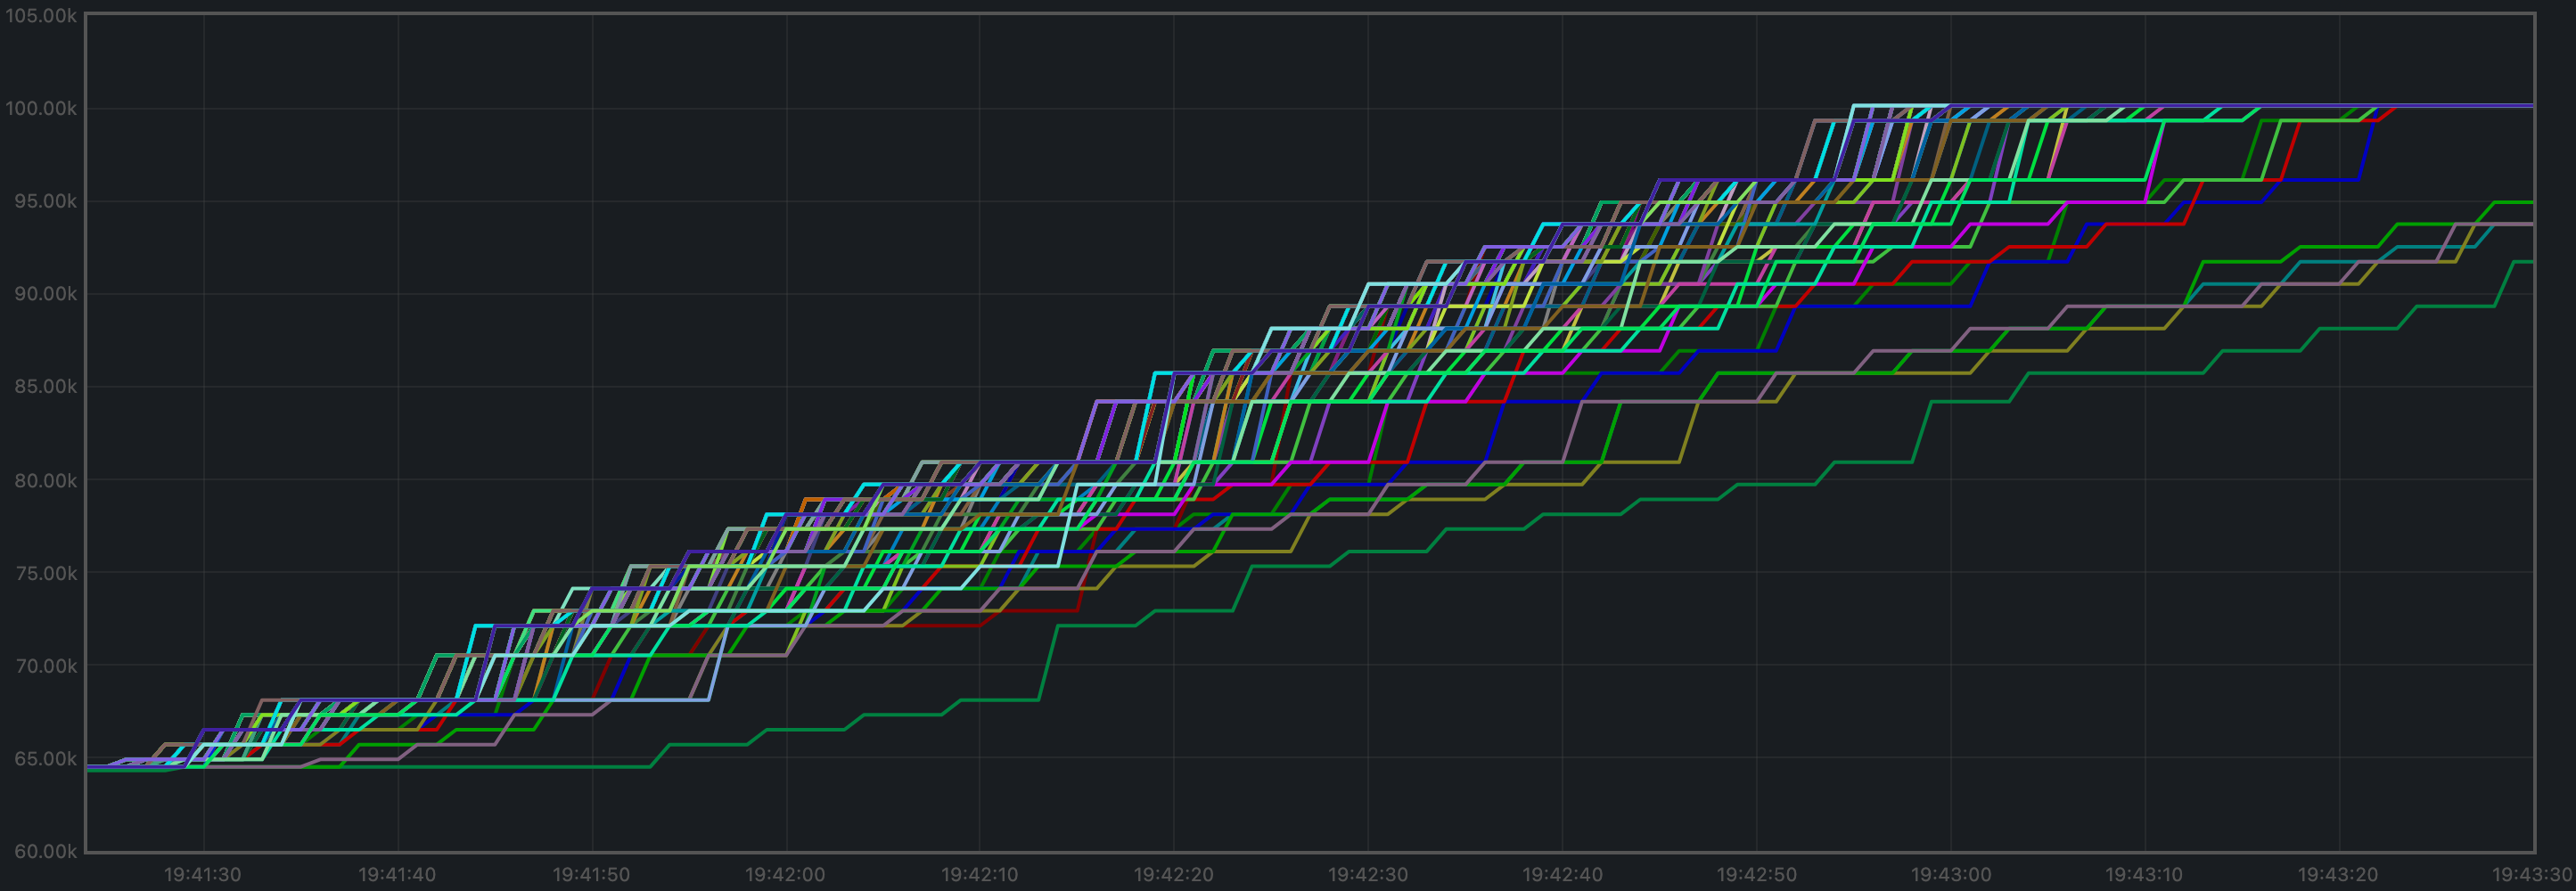
Over a period of 2 minutes, the total goes from 64525 to 100125 transactions, resulting in 17800 transactions per minute. However, we can see in the plot that all transactions in the load are processed long before the two minutes. If we adjust the time window when transactions are processed (approx. 105 seconds), we obtain 20343 transactions per minute.
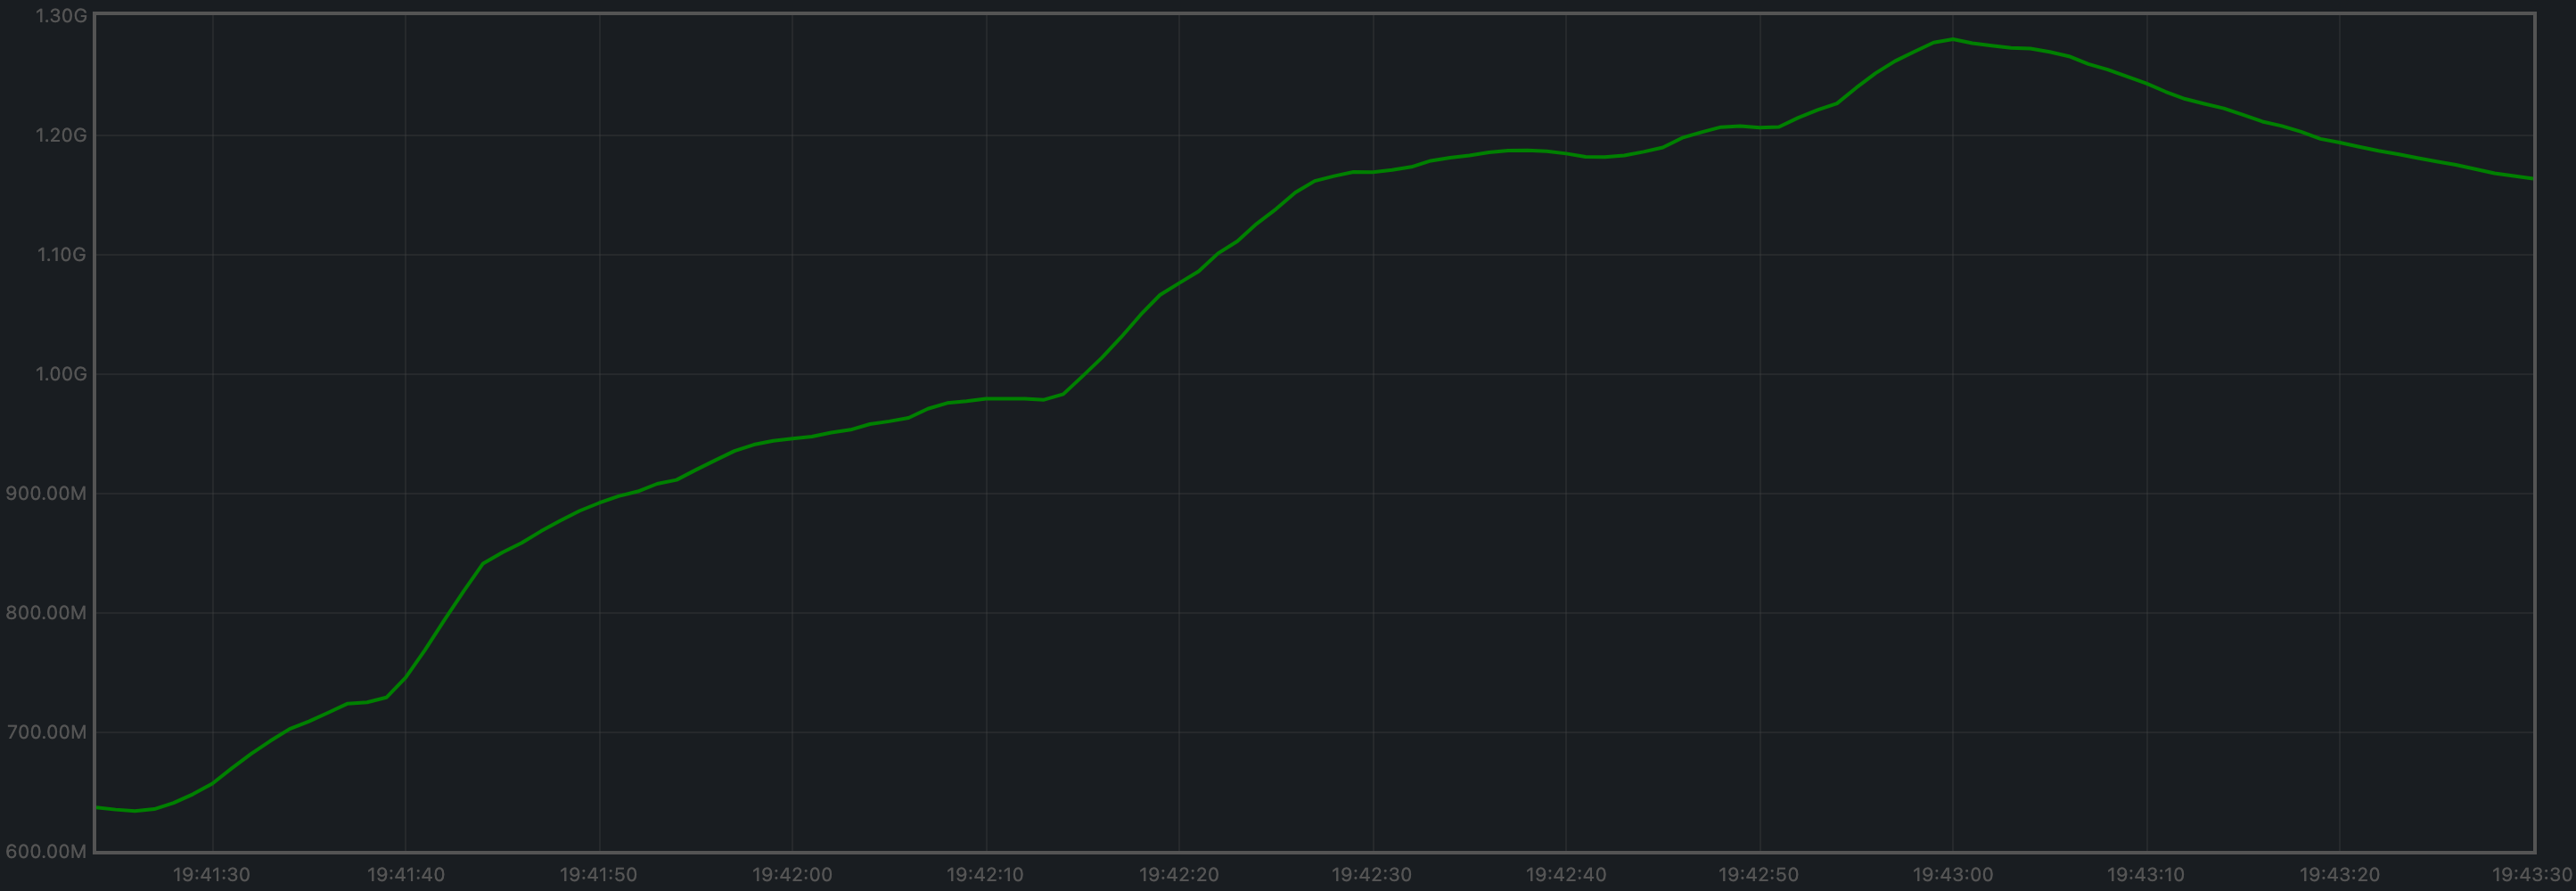
# Memory Resident Set Size
Resident Set Size of all monitored processes is plotted below.
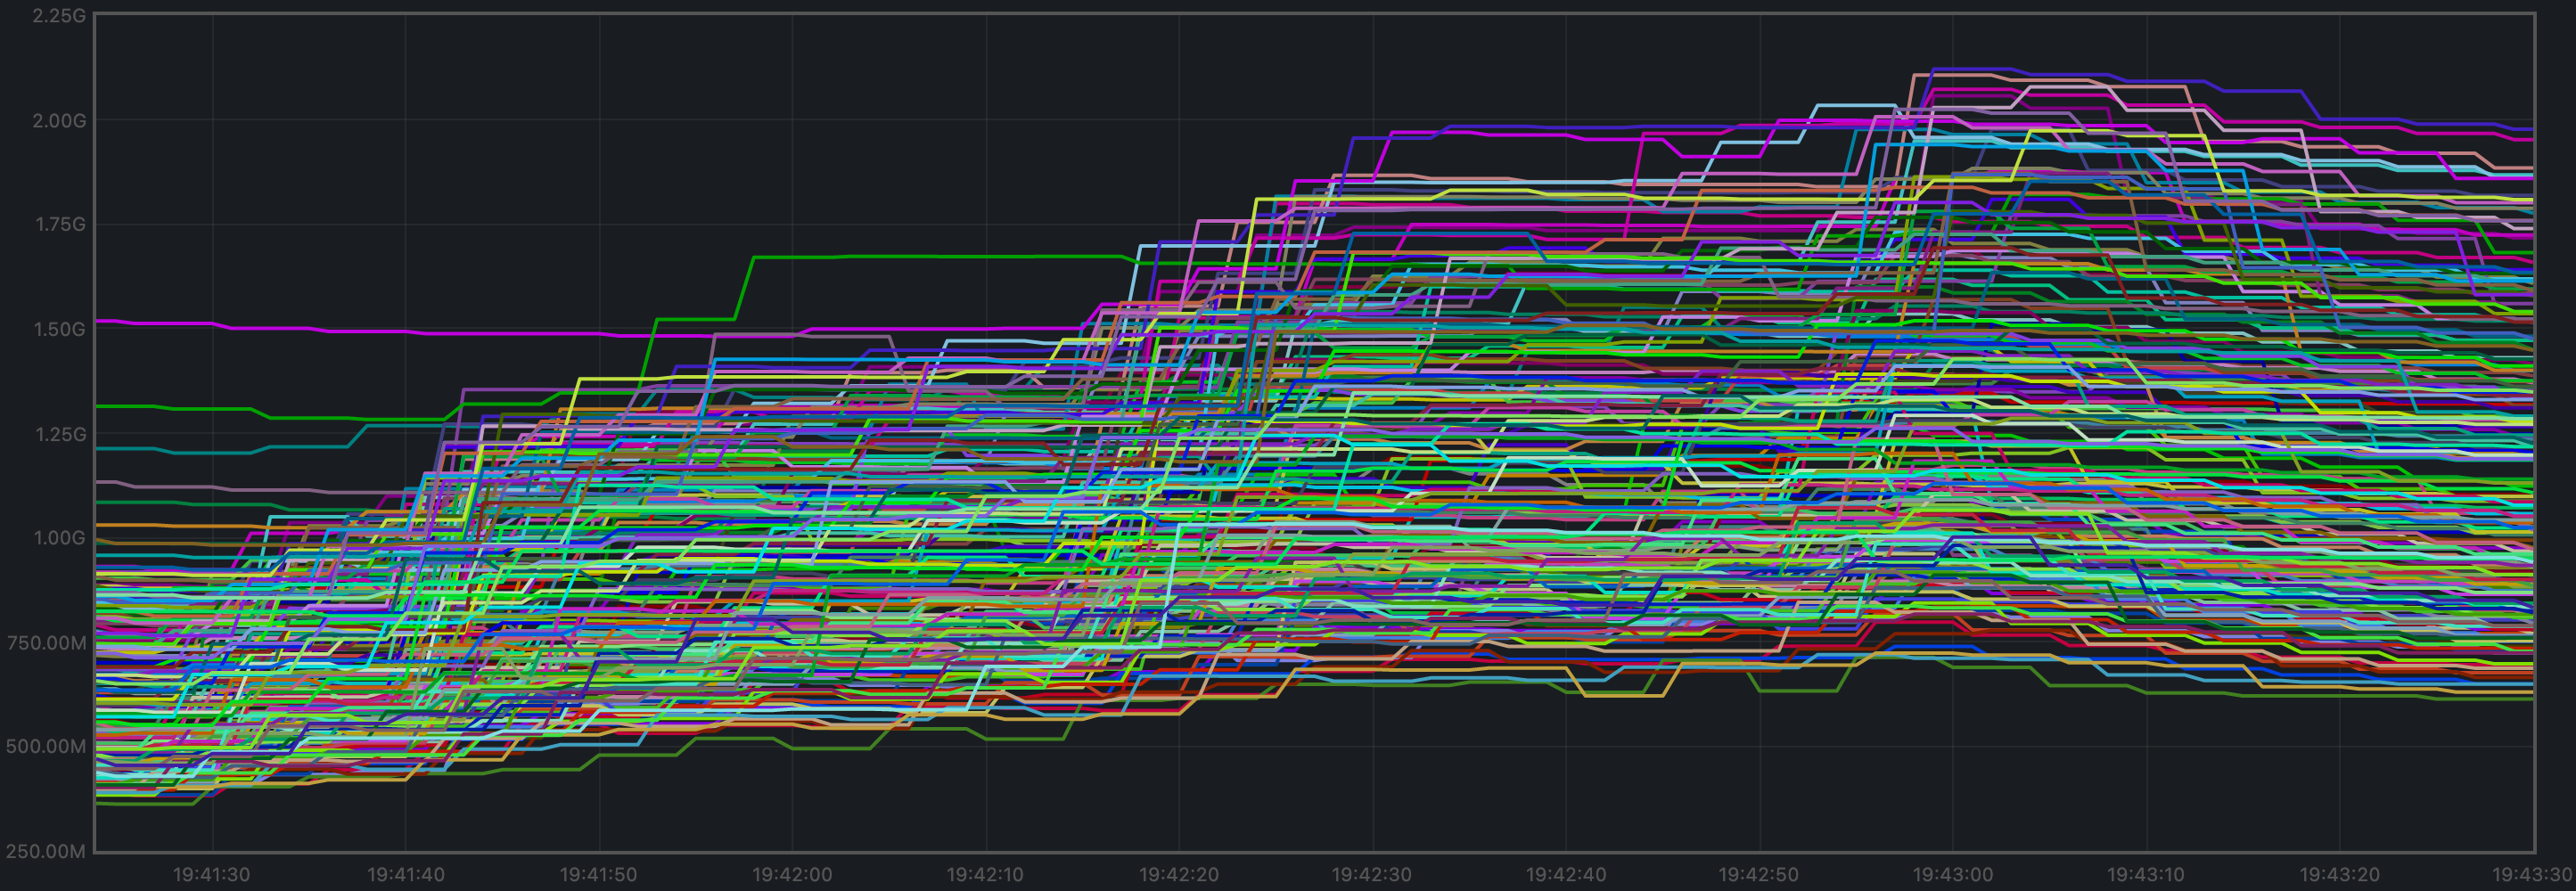
The average over all processes oscillates around 1.2 GiB and does not demonstrate unconstrained growth.
# CPU utilization
The best metric from Prometheus to gauge CPU utilization in a Unix machine is load1,
as it usually appears in the
output of top (opens new window).
It is contained in most cases below 5, which is generally considered acceptable load.
# Test Result
Result: N/A (v0.34.x is the baseline)
Date: 2022-10-14
Version: 3ec6e424d6ae4c96867c2dcf8310572156068bb6
# Rotating Node Testnet
For this testnet, we will use a load that can safely be considered below the saturation
point for the size of this testnet (between 13 and 38 full nodes): c=4,r=800.
N.B.: The version of Tendermint used for these tests is affected by #9539. However, the reduced load that reaches the mempools is orthogonal to functionality we are focusing on here.
# Latencies
The plot of all latencies can be seen in the following plot.
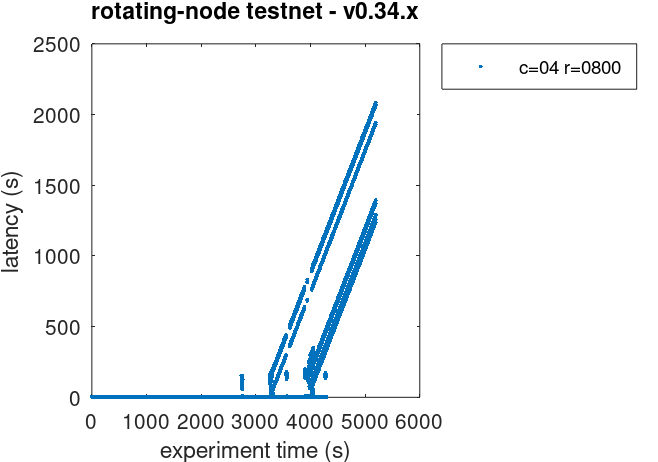
We can observe there are some very high latencies, towards the end of the test. Upon suspicion that they are duplicate transactions, we examined the latencies raw file and discovered there are more than 100K duplicate transactions.
The following plot shows the latencies file where all duplicate transactions have been removed, i.e., only the first occurrence of a duplicate transaction is kept.
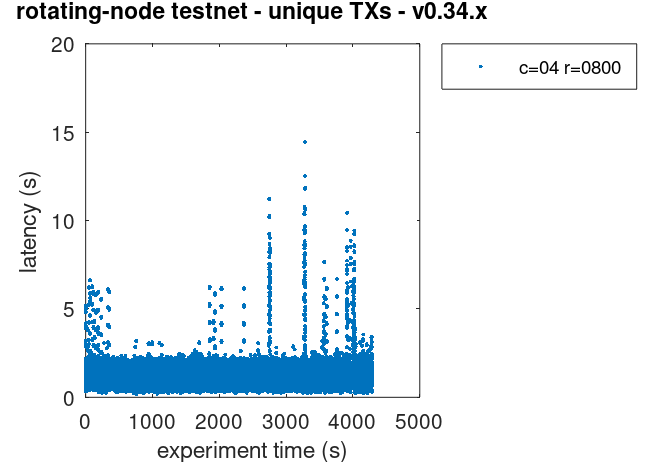
This problem, existing in v0.34.x, will need to be addressed, perhaps in the same way
we addressed it when running the 200 node test with high loads: increasing the cache_size
configuration parameter.
# Prometheus Metrics
The set of metrics shown here are less than for the 200 node experiment. We are only interested in those for which the catch-up process (blocksync) may have an impact.
# Blocks and Transactions per minute
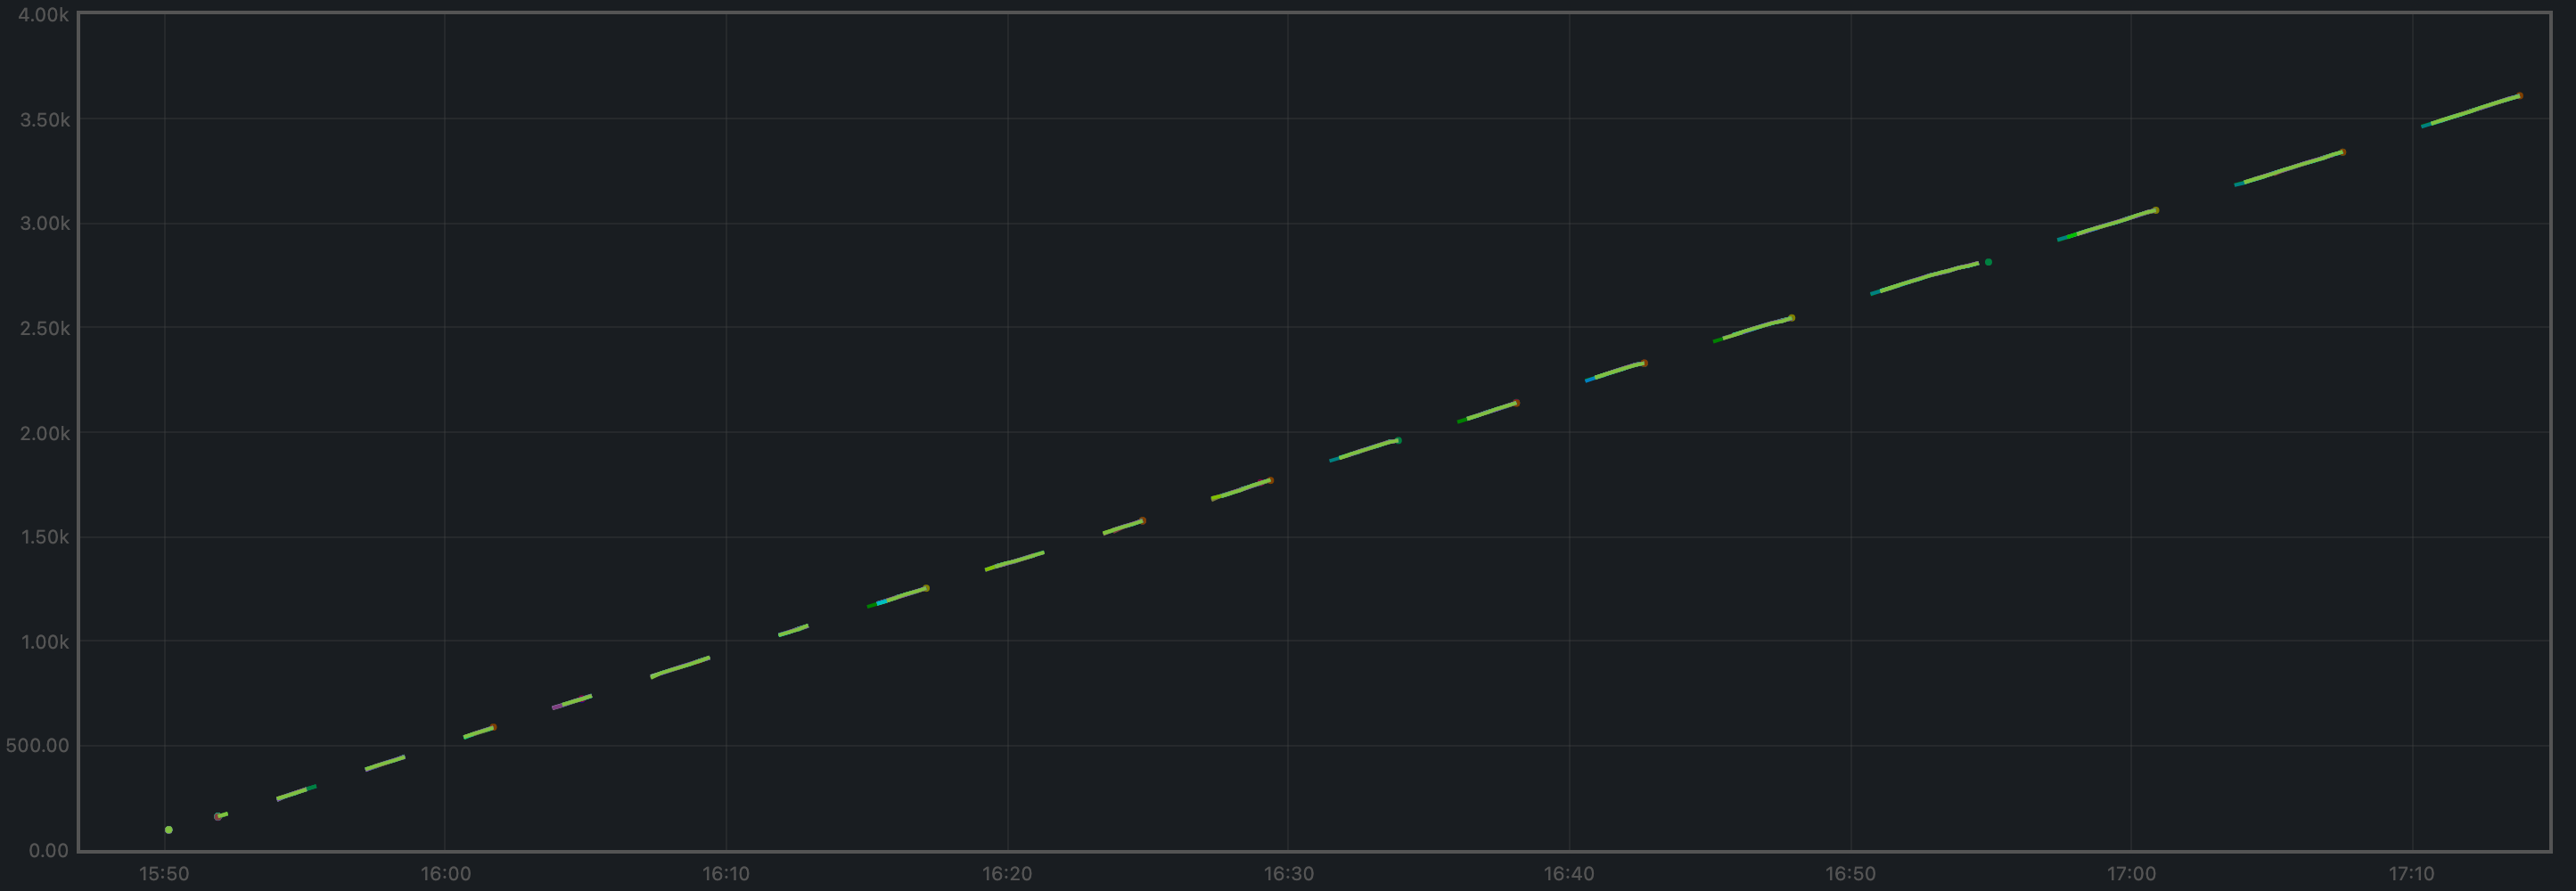
Just as shown for the 200 node test, the blocks produced per minute are the gradient of this plot.
Over a period of 5229 seconds, the height goes from 2 to 3638. This results in an average of 41 blocks produced per minute.
The following plot shows only the heights reported by ephemeral nodes (which are also included in the plot above). Note that the height metric is only showed once the node has switched to consensus, hence the gaps when nodes are killed, wiped out, started from scratch, and catching up.
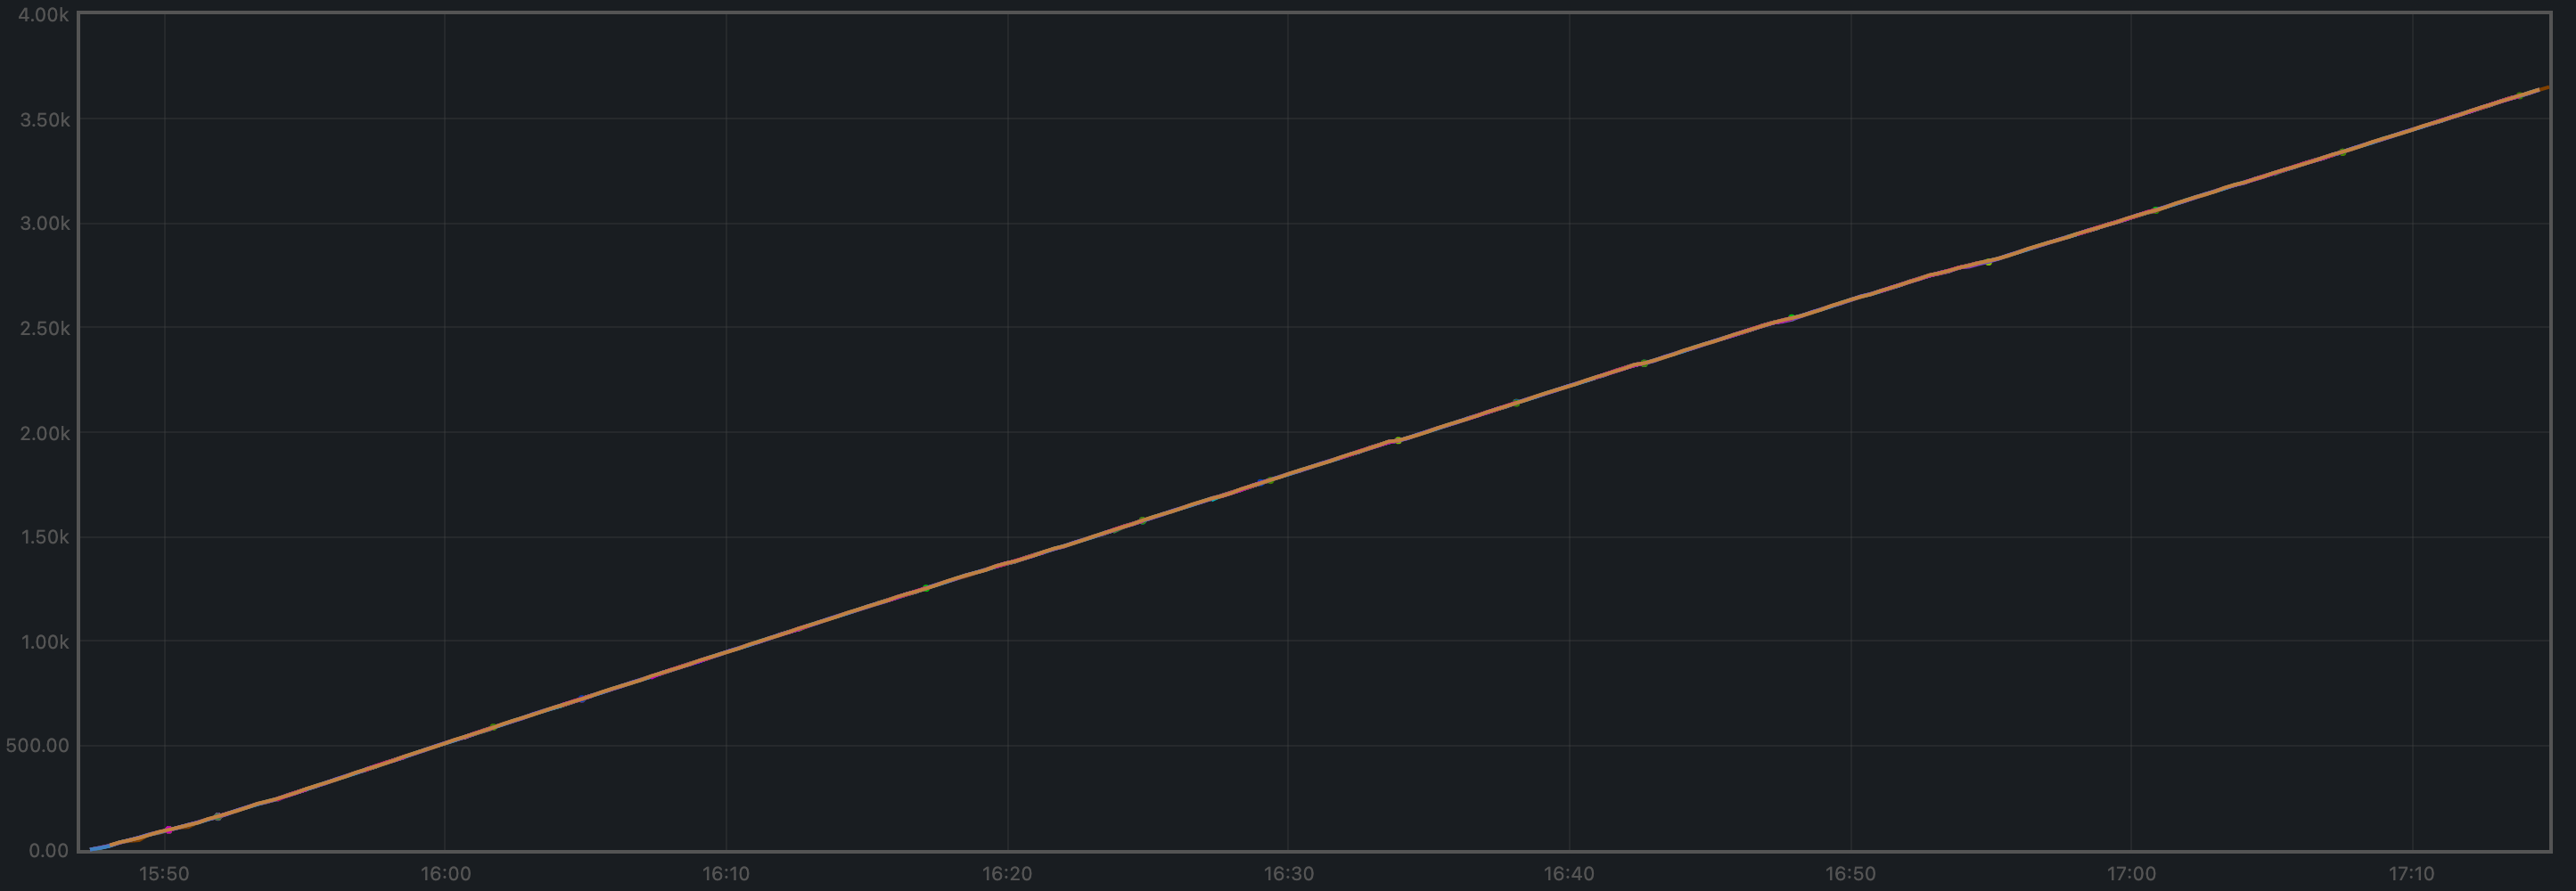
The transactions processed per minute are the gradient of this plot.
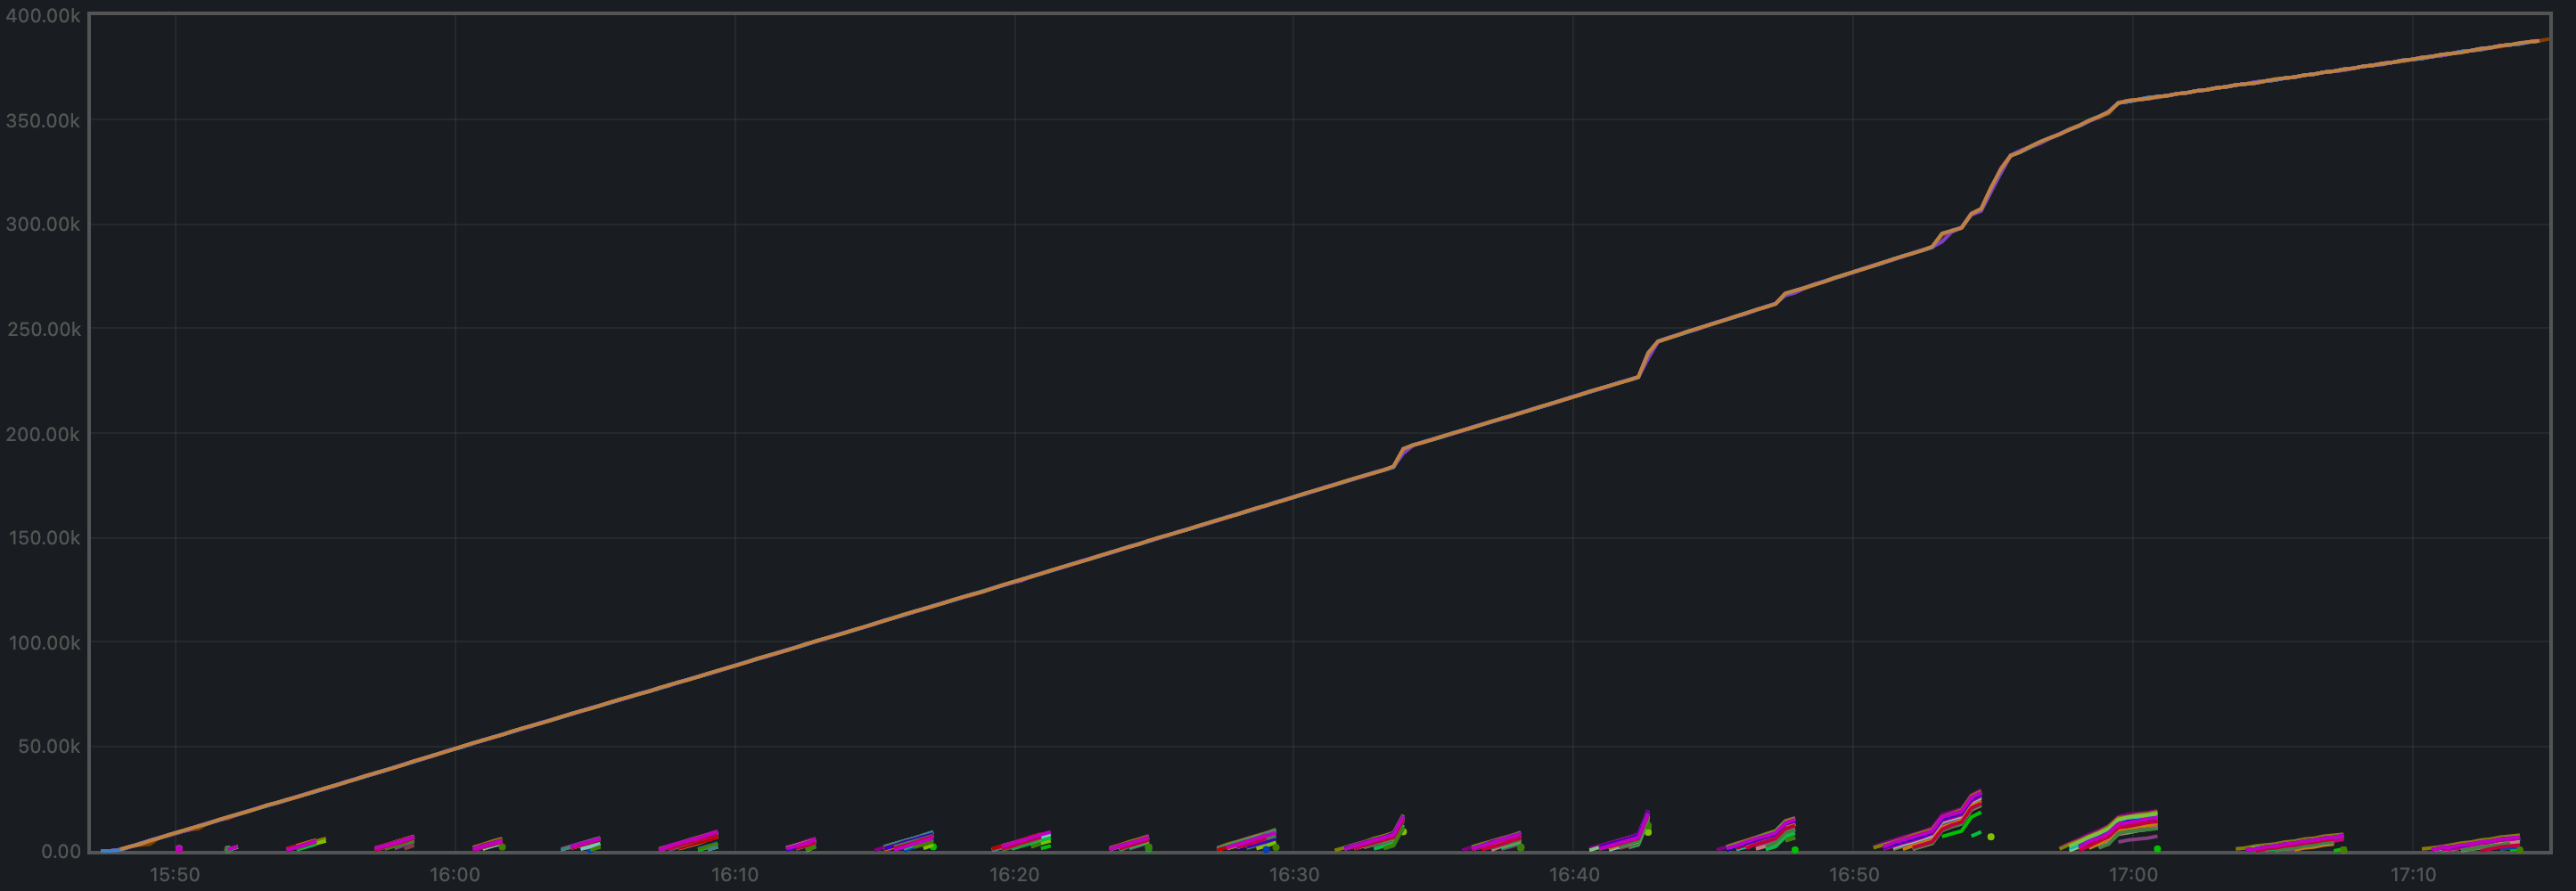
The small lines we see periodically close to y=0 are the transactions that
ephemeral nodes start processing when they are caught up.
Over a period of 5229 minutes, the total goes from 0 to 387697 transactions, resulting in 4449 transactions per minute. We can see some abrupt changes in the plot's gradient. This will need to be investigated.
# Peers
The plot below shows the evolution in peers throughout the experiment. The periodic changes observed are due to the ephemeral nodes being stopped, wiped out, and recreated.
The validators' plots are concentrated at the higher part of the graph, whereas the ephemeral nodes are mostly at the lower part.
# Memory Resident Set Size
The average Resident Set Size (RSS) over all processes seems stable, and slightly growing toward the end. This might be related to the increased in transaction load observed above.
The memory taken by the validators and the ephemeral nodes (when they are up) is comparable.
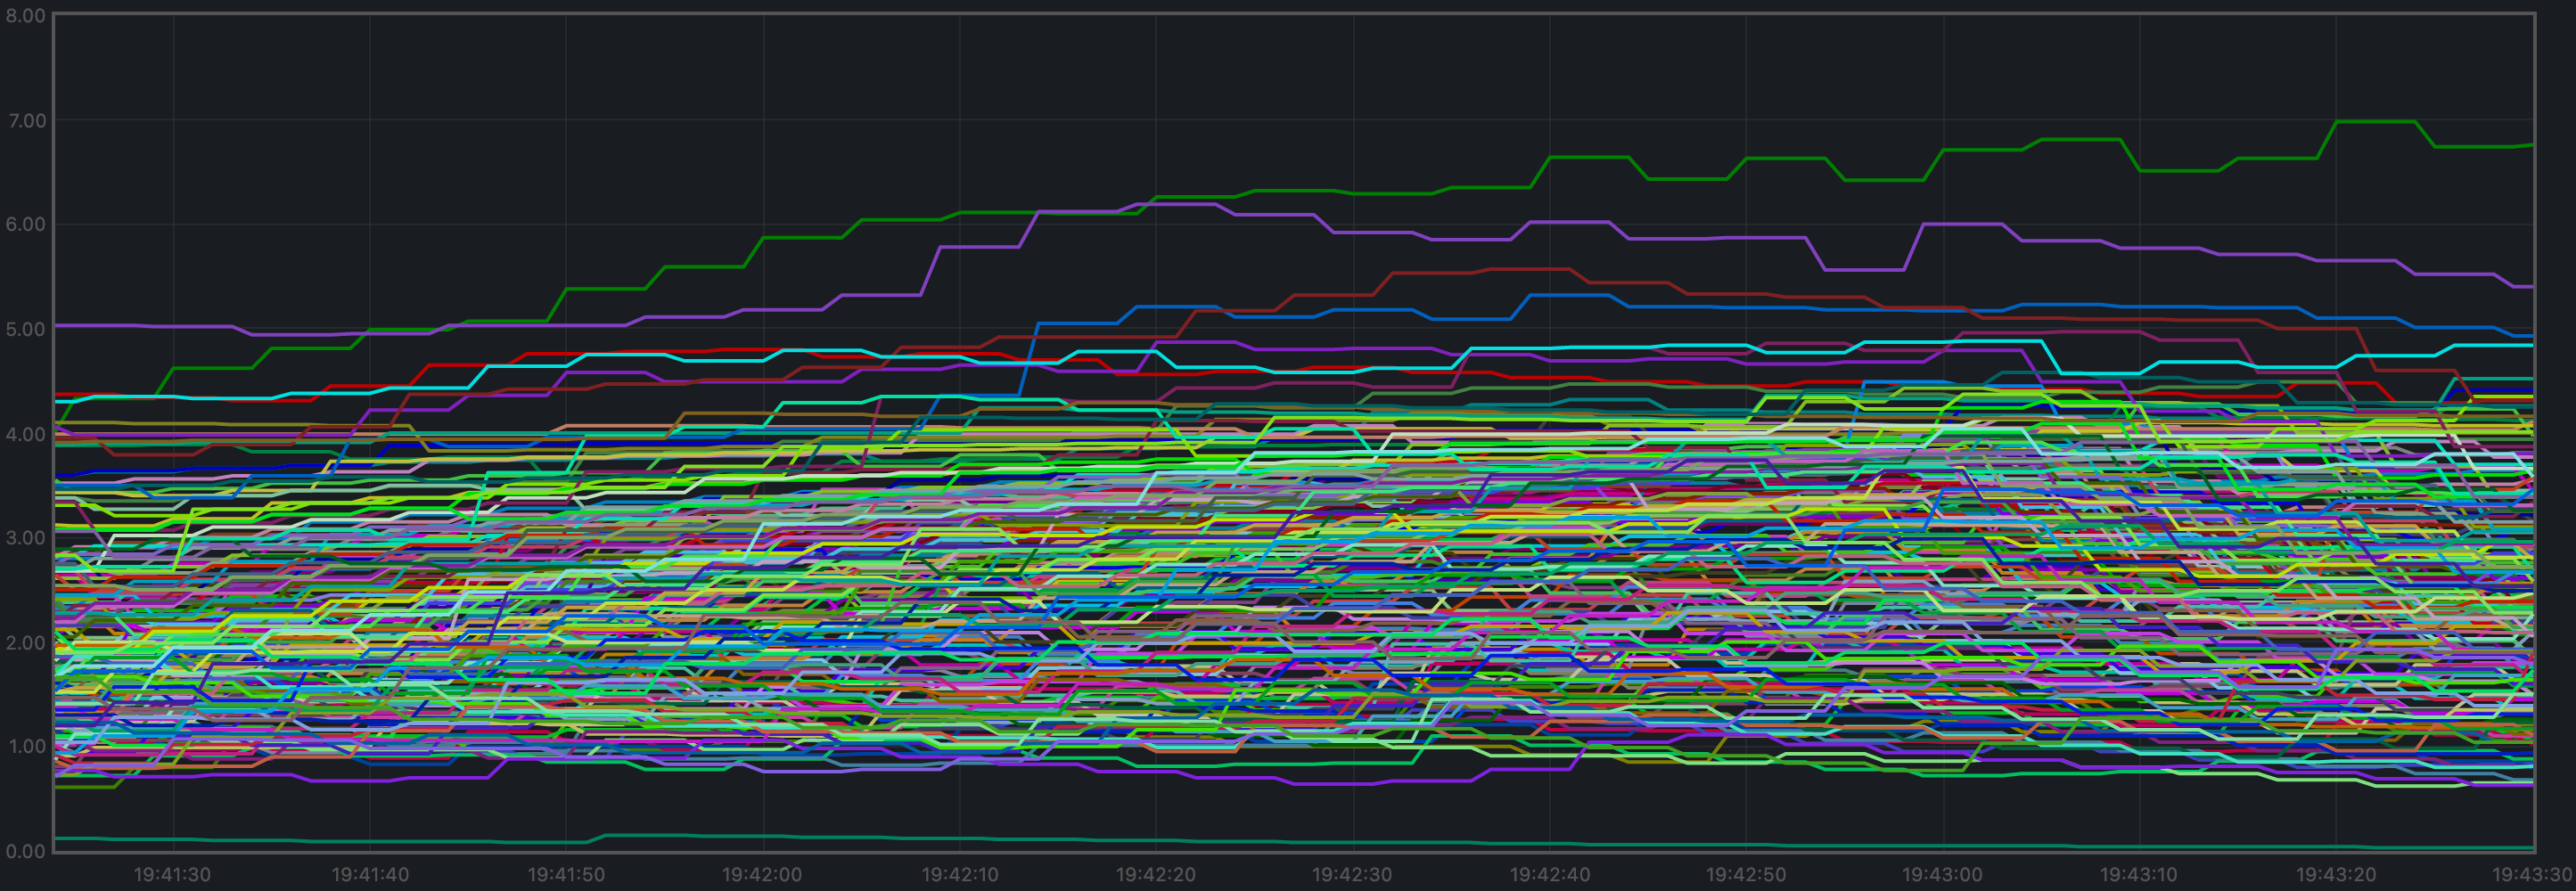
# CPU utilization
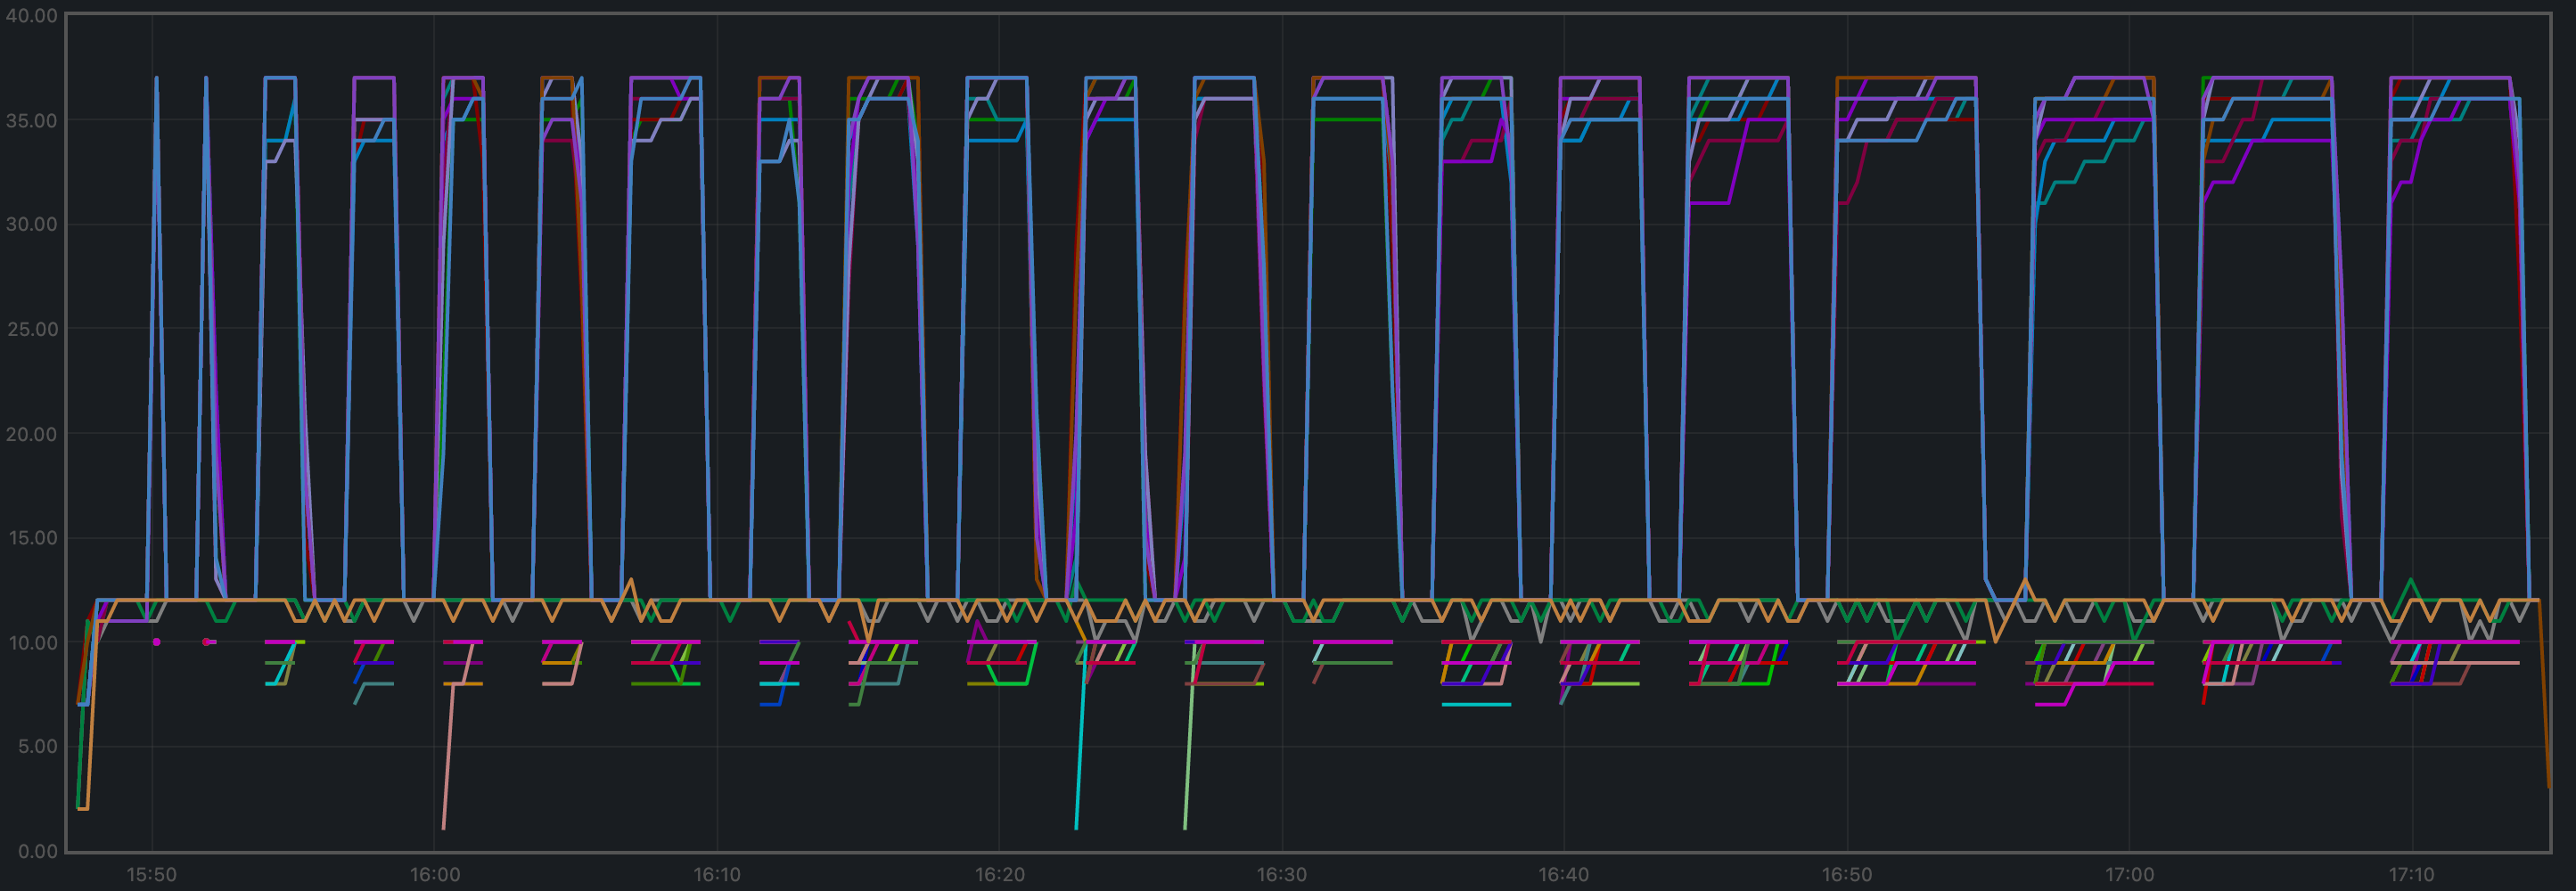
The plot shows metric load1 for all nodes.
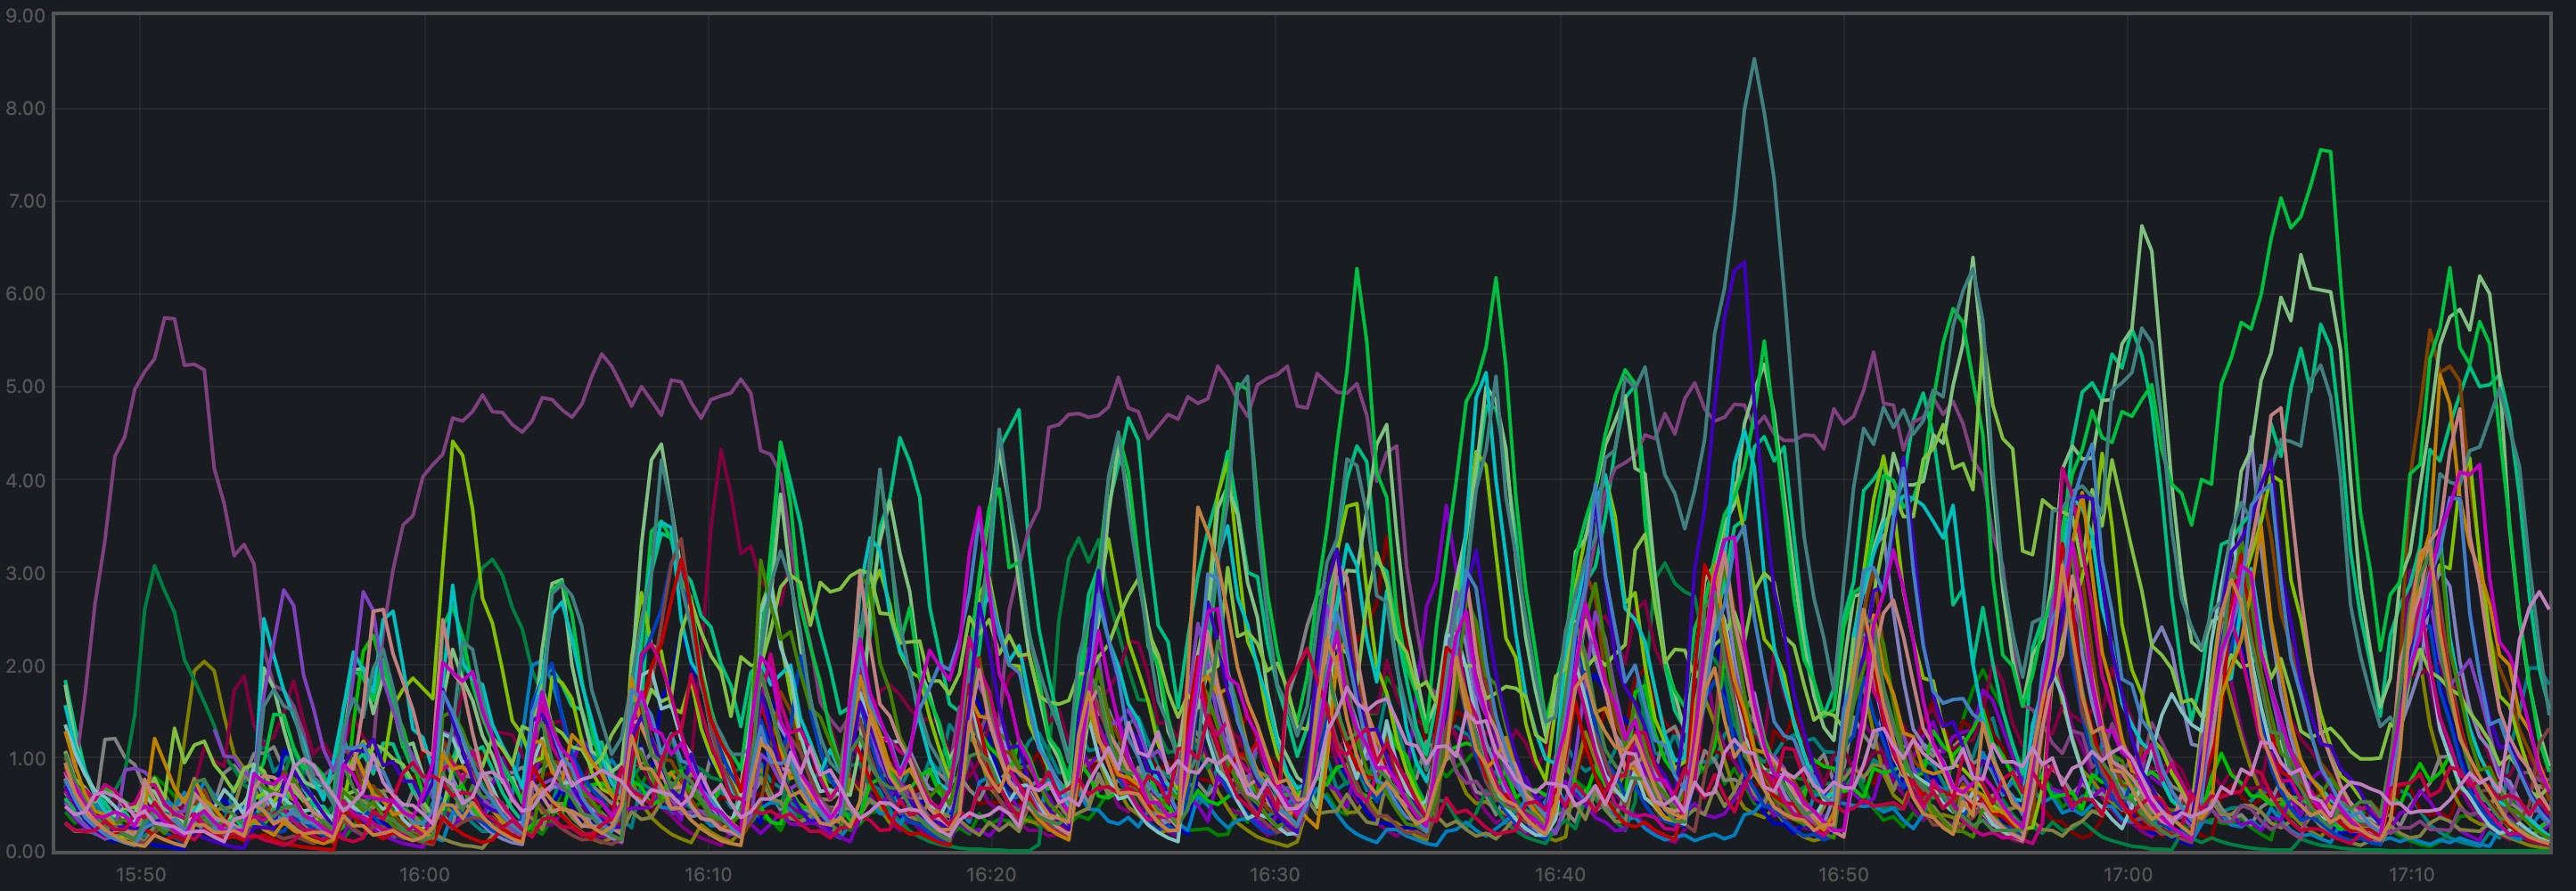
It is contained under 5 most of the time, which is considered normal load. The purple line, which follows a different pattern is the validator receiving all transactions, via RPC, from the load runner process.
# Test Result
Result: N/A
Date: 2022-10-10
Version: a28c987f5a604ff66b515dd415270063e6fb069d